Senegalese vs Immigrants from Norway 11th Grade
COMPARE
Senegalese
Immigrants from Norway
11th Grade
11th Grade Comparison
Senegalese
Immigrants from Norway
91.6%
11TH GRADE
1.4/ 100
METRIC RATING
244th/ 347
METRIC RANK
93.5%
11TH GRADE
98.4/ 100
METRIC RATING
107th/ 347
METRIC RANK
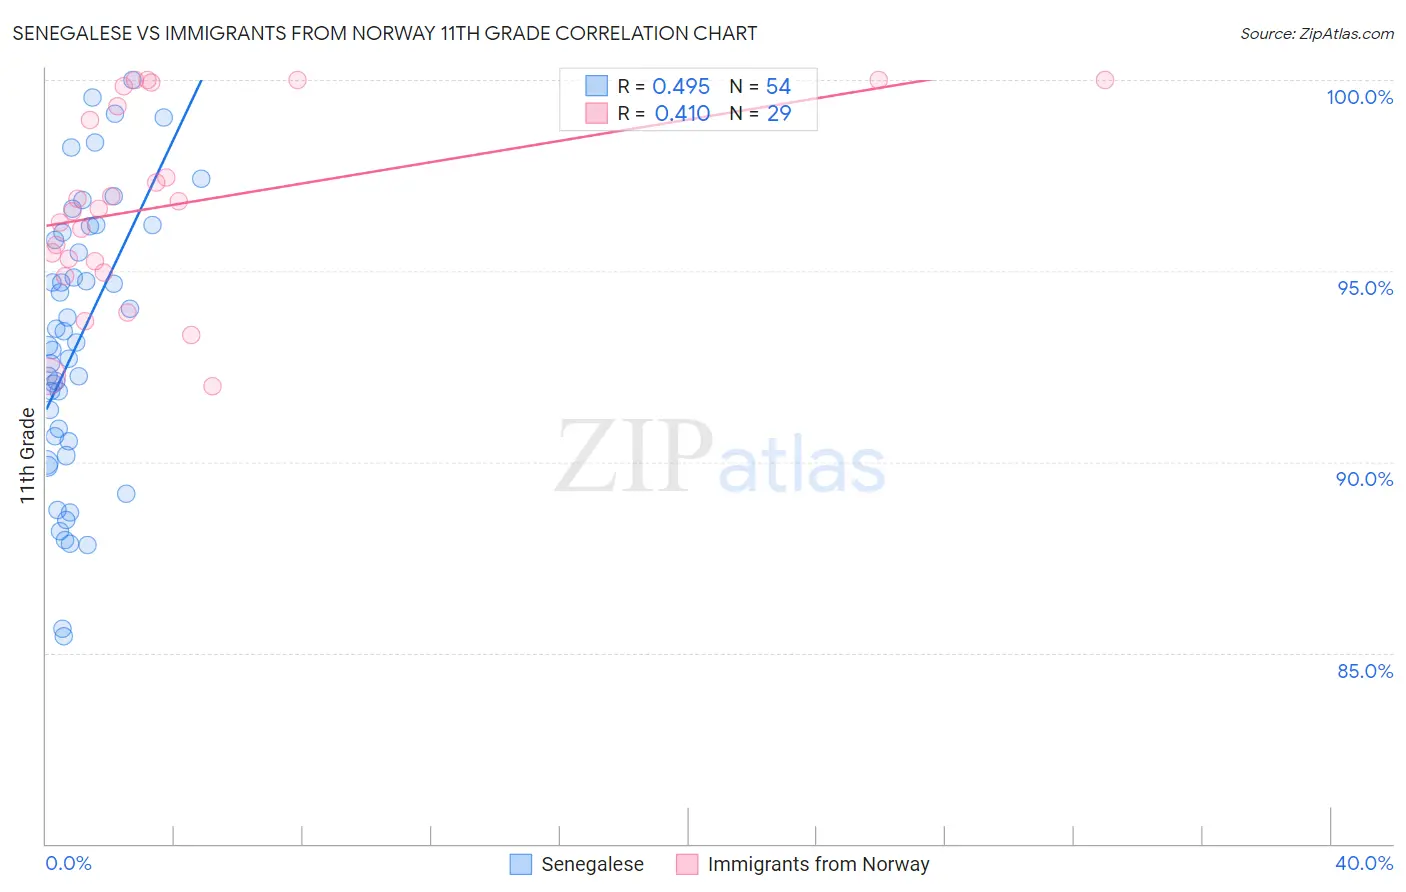
Senegalese vs Immigrants from Norway 11th Grade Correlation Chart
The statistical analysis conducted on geographies consisting of 78,142,569 people shows a moderate positive correlation between the proportion of Senegalese and percentage of population with at least 11th grade education in the United States with a correlation coefficient (R) of 0.495 and weighted average of 91.6%. Similarly, the statistical analysis conducted on geographies consisting of 116,716,420 people shows a moderate positive correlation between the proportion of Immigrants from Norway and percentage of population with at least 11th grade education in the United States with a correlation coefficient (R) of 0.410 and weighted average of 93.5%, a difference of 2.1%.
11th Grade Correlation Summary
| Measurement | Senegalese | Immigrants from Norway |
| Minimum | 85.4% | 92.0% |
| Maximum | 100.0% | 100.0% |
| Range | 14.6% | 8.0% |
| Mean | 93.1% | 96.8% |
| Median | 93.1% | 96.6% |
| Interquartile 25% (IQ1) | 90.5% | 95.1% |
| Interquartile 75% (IQ3) | 96.0% | 99.6% |
| Interquartile Range (IQR) | 5.5% | 4.5% |
| Standard Deviation (Sample) | 3.6% | 2.5% |
| Standard Deviation (Population) | 3.6% | 2.4% |
Similar Demographics by 11th Grade
Demographics Similar to Senegalese by 11th Grade
In terms of 11th grade, the demographic groups most similar to Senegalese are Immigrants from Thailand (91.6%, a difference of 0.010%), African (91.5%, a difference of 0.010%), Immigrants from Middle Africa (91.6%, a difference of 0.030%), Seminole (91.5%, a difference of 0.050%), and Bahamian (91.6%, a difference of 0.070%).
| Demographics | Rating | Rank | 11th Grade |
| Immigrants | Bolivia | 2.8 /100 | #237 | Tragic 91.7% |
| Comanche | 2.6 /100 | #238 | Tragic 91.7% |
| Hopi | 2.5 /100 | #239 | Tragic 91.7% |
| South Americans | 2.0 /100 | #240 | Tragic 91.6% |
| Bahamians | 1.8 /100 | #241 | Tragic 91.6% |
| Immigrants | Middle Africa | 1.6 /100 | #242 | Tragic 91.6% |
| Immigrants | Thailand | 1.4 /100 | #243 | Tragic 91.6% |
| Senegalese | 1.4 /100 | #244 | Tragic 91.6% |
| Africans | 1.3 /100 | #245 | Tragic 91.5% |
| Seminole | 1.2 /100 | #246 | Tragic 91.5% |
| Immigrants | Philippines | 1.0 /100 | #247 | Tragic 91.5% |
| Immigrants | Uzbekistan | 1.0 /100 | #248 | Tragic 91.5% |
| Peruvians | 1.0 /100 | #249 | Tragic 91.5% |
| Ghanaians | 0.9 /100 | #250 | Tragic 91.5% |
| Immigrants | Costa Rica | 0.9 /100 | #251 | Tragic 91.4% |
Demographics Similar to Immigrants from Norway by 11th Grade
In terms of 11th grade, the demographic groups most similar to Immigrants from Norway are Alaska Native (93.5%, a difference of 0.0%), Immigrants from Kuwait (93.5%, a difference of 0.010%), Syrian (93.4%, a difference of 0.010%), Lebanese (93.5%, a difference of 0.020%), and Immigrants from Europe (93.5%, a difference of 0.020%).
| Demographics | Rating | Rank | 11th Grade |
| Immigrants | North Macedonia | 98.7 /100 | #100 | Exceptional 93.5% |
| Immigrants | Romania | 98.7 /100 | #101 | Exceptional 93.5% |
| Chippewa | 98.6 /100 | #102 | Exceptional 93.5% |
| Lebanese | 98.6 /100 | #103 | Exceptional 93.5% |
| Immigrants | Europe | 98.6 /100 | #104 | Exceptional 93.5% |
| Immigrants | Serbia | 98.6 /100 | #105 | Exceptional 93.5% |
| Immigrants | Croatia | 98.6 /100 | #106 | Exceptional 93.5% |
| Immigrants | Norway | 98.4 /100 | #107 | Exceptional 93.5% |
| Alaska Natives | 98.4 /100 | #108 | Exceptional 93.5% |
| Immigrants | Kuwait | 98.4 /100 | #109 | Exceptional 93.5% |
| Syrians | 98.4 /100 | #110 | Exceptional 93.4% |
| Yugoslavians | 98.1 /100 | #111 | Exceptional 93.4% |
| Immigrants | Germany | 98.0 /100 | #112 | Exceptional 93.4% |
| Immigrants | Zimbabwe | 97.8 /100 | #113 | Exceptional 93.4% |
| Jordanians | 97.8 /100 | #114 | Exceptional 93.4% |