Senegalese vs Central American 11th Grade
COMPARE
Senegalese
Central American
11th Grade
11th Grade Comparison
Senegalese
Central Americans
91.6%
11TH GRADE
1.4/ 100
METRIC RATING
244th/ 347
METRIC RANK
86.9%
11TH GRADE
0.0/ 100
METRIC RATING
335th/ 347
METRIC RANK
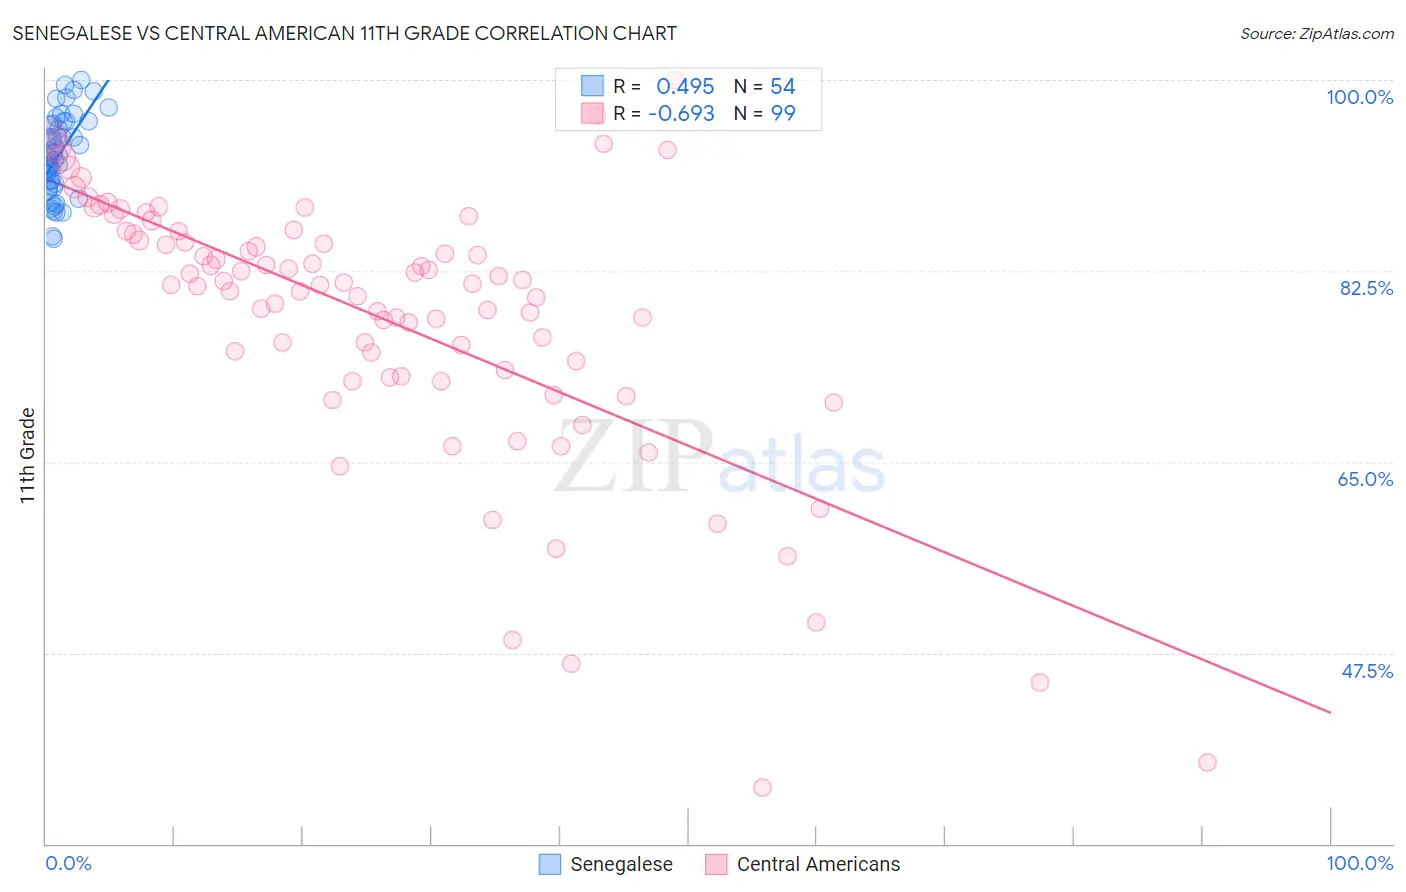
Senegalese vs Central American 11th Grade Correlation Chart
The statistical analysis conducted on geographies consisting of 78,142,569 people shows a moderate positive correlation between the proportion of Senegalese and percentage of population with at least 11th grade education in the United States with a correlation coefficient (R) of 0.495 and weighted average of 91.6%. Similarly, the statistical analysis conducted on geographies consisting of 504,619,347 people shows a significant negative correlation between the proportion of Central Americans and percentage of population with at least 11th grade education in the United States with a correlation coefficient (R) of -0.693 and weighted average of 86.9%, a difference of 5.3%.
11th Grade Correlation Summary
| Measurement | Senegalese | Central American |
| Minimum | 85.4% | 35.2% |
| Maximum | 100.0% | 100.0% |
| Range | 14.6% | 64.8% |
| Mean | 93.1% | 78.1% |
| Median | 93.1% | 81.3% |
| Interquartile 25% (IQ1) | 90.5% | 72.9% |
| Interquartile 75% (IQ3) | 96.0% | 85.9% |
| Interquartile Range (IQR) | 5.5% | 13.0% |
| Standard Deviation (Sample) | 3.6% | 12.4% |
| Standard Deviation (Population) | 3.6% | 12.3% |
Similar Demographics by 11th Grade
Demographics Similar to Senegalese by 11th Grade
In terms of 11th grade, the demographic groups most similar to Senegalese are Immigrants from Thailand (91.6%, a difference of 0.010%), African (91.5%, a difference of 0.010%), Immigrants from Middle Africa (91.6%, a difference of 0.030%), Seminole (91.5%, a difference of 0.050%), and Bahamian (91.6%, a difference of 0.070%).
| Demographics | Rating | Rank | 11th Grade |
| Immigrants | Bolivia | 2.8 /100 | #237 | Tragic 91.7% |
| Comanche | 2.6 /100 | #238 | Tragic 91.7% |
| Hopi | 2.5 /100 | #239 | Tragic 91.7% |
| South Americans | 2.0 /100 | #240 | Tragic 91.6% |
| Bahamians | 1.8 /100 | #241 | Tragic 91.6% |
| Immigrants | Middle Africa | 1.6 /100 | #242 | Tragic 91.6% |
| Immigrants | Thailand | 1.4 /100 | #243 | Tragic 91.6% |
| Senegalese | 1.4 /100 | #244 | Tragic 91.6% |
| Africans | 1.3 /100 | #245 | Tragic 91.5% |
| Seminole | 1.2 /100 | #246 | Tragic 91.5% |
| Immigrants | Philippines | 1.0 /100 | #247 | Tragic 91.5% |
| Immigrants | Uzbekistan | 1.0 /100 | #248 | Tragic 91.5% |
| Peruvians | 1.0 /100 | #249 | Tragic 91.5% |
| Ghanaians | 0.9 /100 | #250 | Tragic 91.5% |
| Immigrants | Costa Rica | 0.9 /100 | #251 | Tragic 91.4% |
Demographics Similar to Central Americans by 11th Grade
In terms of 11th grade, the demographic groups most similar to Central Americans are Immigrants from Dominican Republic (86.9%, a difference of 0.040%), Immigrants from Honduras (86.9%, a difference of 0.040%), Houma (87.0%, a difference of 0.10%), Immigrants from Yemen (87.1%, a difference of 0.16%), and Immigrants from Latin America (86.8%, a difference of 0.17%).
| Demographics | Rating | Rank | 11th Grade |
| Tohono O'odham | 0.0 /100 | #328 | Tragic 87.6% |
| Mexican American Indians | 0.0 /100 | #329 | Tragic 87.5% |
| Hondurans | 0.0 /100 | #330 | Tragic 87.4% |
| Hispanics or Latinos | 0.0 /100 | #331 | Tragic 87.3% |
| Immigrants | Azores | 0.0 /100 | #332 | Tragic 87.2% |
| Immigrants | Yemen | 0.0 /100 | #333 | Tragic 87.1% |
| Houma | 0.0 /100 | #334 | Tragic 87.0% |
| Central Americans | 0.0 /100 | #335 | Tragic 86.9% |
| Immigrants | Dominican Republic | 0.0 /100 | #336 | Tragic 86.9% |
| Immigrants | Honduras | 0.0 /100 | #337 | Tragic 86.9% |
| Immigrants | Latin America | 0.0 /100 | #338 | Tragic 86.8% |
| Guatemalans | 0.0 /100 | #339 | Tragic 86.4% |
| Salvadorans | 0.0 /100 | #340 | Tragic 86.2% |
| Mexicans | 0.0 /100 | #341 | Tragic 86.1% |
| Immigrants | Guatemala | 0.0 /100 | #342 | Tragic 85.8% |