Immigrants from Hungary vs Immigrants from Caribbean 11th Grade
COMPARE
Immigrants from Hungary
Immigrants from Caribbean
11th Grade
11th Grade Comparison
Immigrants from Hungary
Immigrants from Caribbean
93.4%
11TH GRADE
97.5/ 100
METRIC RATING
116th/ 347
METRIC RANK
89.1%
11TH GRADE
0.0/ 100
METRIC RATING
313th/ 347
METRIC RANK
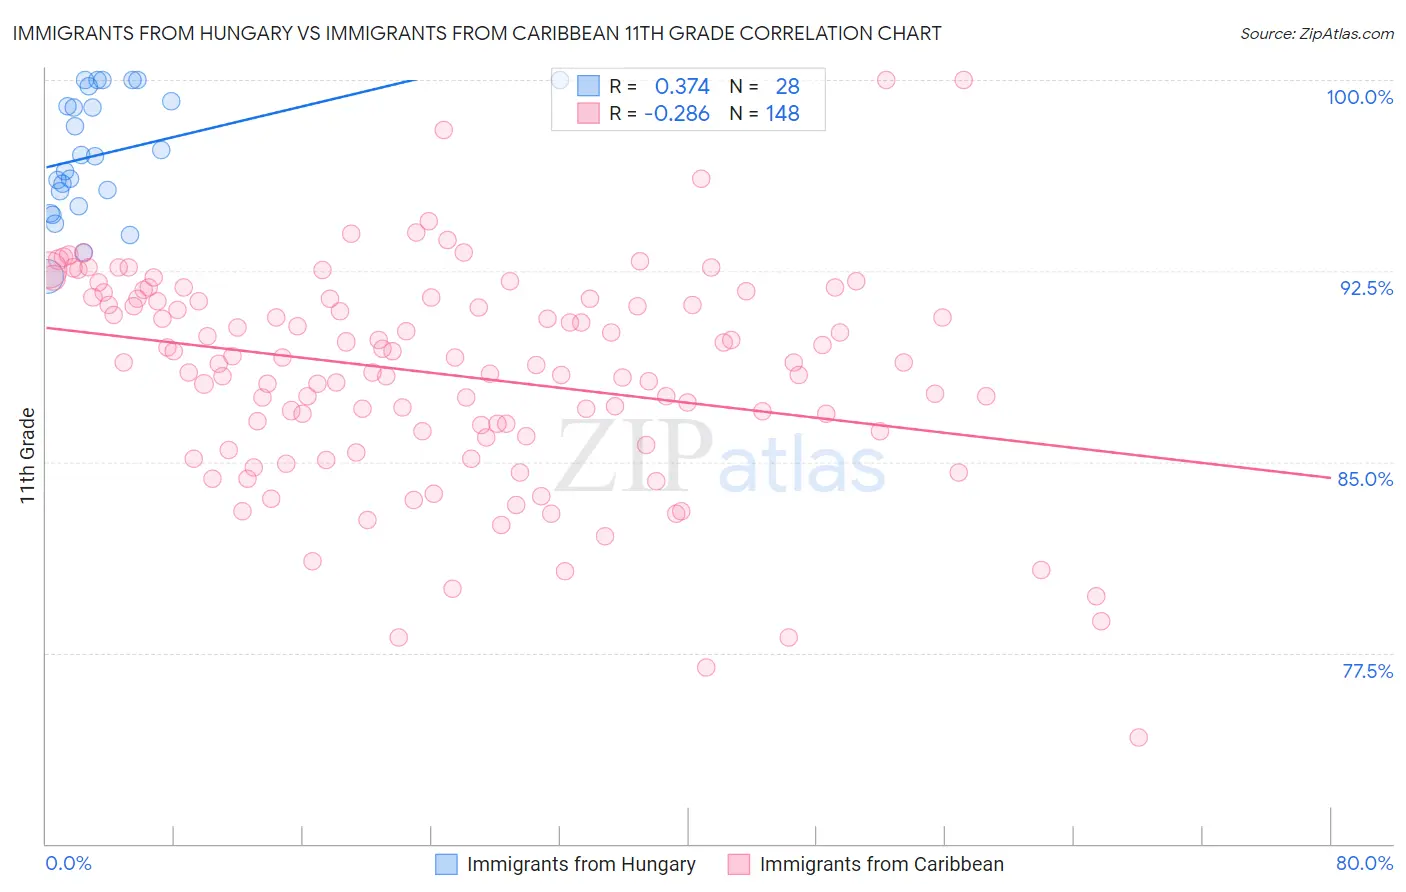
Immigrants from Hungary vs Immigrants from Caribbean 11th Grade Correlation Chart
The statistical analysis conducted on geographies consisting of 195,707,305 people shows a mild positive correlation between the proportion of Immigrants from Hungary and percentage of population with at least 11th grade education in the United States with a correlation coefficient (R) of 0.374 and weighted average of 93.4%. Similarly, the statistical analysis conducted on geographies consisting of 450,064,731 people shows a weak negative correlation between the proportion of Immigrants from Caribbean and percentage of population with at least 11th grade education in the United States with a correlation coefficient (R) of -0.286 and weighted average of 89.1%, a difference of 4.8%.
11th Grade Correlation Summary
| Measurement | Immigrants from Hungary | Immigrants from Caribbean |
| Minimum | 92.3% | 74.2% |
| Maximum | 100.0% | 100.0% |
| Range | 7.7% | 25.8% |
| Mean | 97.1% | 88.4% |
| Median | 97.0% | 88.9% |
| Interquartile 25% (IQ1) | 95.4% | 86.1% |
| Interquartile 75% (IQ3) | 99.5% | 91.4% |
| Interquartile Range (IQR) | 4.1% | 5.3% |
| Standard Deviation (Sample) | 2.4% | 4.3% |
| Standard Deviation (Population) | 2.3% | 4.2% |
Similar Demographics by 11th Grade
Demographics Similar to Immigrants from Hungary by 11th Grade
In terms of 11th grade, the demographic groups most similar to Immigrants from Hungary are White/Caucasian (93.3%, a difference of 0.010%), Palestinian (93.4%, a difference of 0.020%), Immigrants from Zimbabwe (93.4%, a difference of 0.030%), Jordanian (93.4%, a difference of 0.030%), and Immigrants from Korea (93.3%, a difference of 0.050%).
| Demographics | Rating | Rank | 11th Grade |
| Immigrants | Kuwait | 98.4 /100 | #109 | Exceptional 93.5% |
| Syrians | 98.4 /100 | #110 | Exceptional 93.4% |
| Yugoslavians | 98.1 /100 | #111 | Exceptional 93.4% |
| Immigrants | Germany | 98.0 /100 | #112 | Exceptional 93.4% |
| Immigrants | Zimbabwe | 97.8 /100 | #113 | Exceptional 93.4% |
| Jordanians | 97.8 /100 | #114 | Exceptional 93.4% |
| Palestinians | 97.7 /100 | #115 | Exceptional 93.4% |
| Immigrants | Hungary | 97.5 /100 | #116 | Exceptional 93.4% |
| Whites/Caucasians | 97.4 /100 | #117 | Exceptional 93.3% |
| Immigrants | Korea | 97.0 /100 | #118 | Exceptional 93.3% |
| Israelis | 97.0 /100 | #119 | Exceptional 93.3% |
| Immigrants | Russia | 96.6 /100 | #120 | Exceptional 93.3% |
| German Russians | 96.4 /100 | #121 | Exceptional 93.3% |
| Immigrants | Belarus | 96.3 /100 | #122 | Exceptional 93.3% |
| Immigrants | Greece | 95.9 /100 | #123 | Exceptional 93.2% |
Demographics Similar to Immigrants from Caribbean by 11th Grade
In terms of 11th grade, the demographic groups most similar to Immigrants from Caribbean are Cape Verdean (89.1%, a difference of 0.020%), Immigrants from Ecuador (89.1%, a difference of 0.030%), Immigrants from Cuba (88.9%, a difference of 0.18%), Lumbee (88.9%, a difference of 0.19%), and Immigrants from Portugal (89.3%, a difference of 0.20%).
| Demographics | Rating | Rank | 11th Grade |
| Ecuadorians | 0.0 /100 | #306 | Tragic 89.6% |
| Immigrants | Dominica | 0.0 /100 | #307 | Tragic 89.5% |
| Nepalese | 0.0 /100 | #308 | Tragic 89.5% |
| Immigrants | Bangladesh | 0.0 /100 | #309 | Tragic 89.5% |
| Yaqui | 0.0 /100 | #310 | Tragic 89.5% |
| Vietnamese | 0.0 /100 | #311 | Tragic 89.4% |
| Immigrants | Portugal | 0.0 /100 | #312 | Tragic 89.3% |
| Immigrants | Caribbean | 0.0 /100 | #313 | Tragic 89.1% |
| Cape Verdeans | 0.0 /100 | #314 | Tragic 89.1% |
| Immigrants | Ecuador | 0.0 /100 | #315 | Tragic 89.1% |
| Immigrants | Cuba | 0.0 /100 | #316 | Tragic 88.9% |
| Lumbee | 0.0 /100 | #317 | Tragic 88.9% |
| Nicaraguans | 0.0 /100 | #318 | Tragic 88.9% |
| Belizeans | 0.0 /100 | #319 | Tragic 88.8% |
| Immigrants | Armenia | 0.0 /100 | #320 | Tragic 88.8% |