Immigrants from Southern Europe vs Cheyenne 4th Grade
COMPARE
Immigrants from Southern Europe
Cheyenne
4th Grade
4th Grade Comparison
Immigrants from Southern Europe
Cheyenne
97.4%
4TH GRADE
16.2/ 100
METRIC RATING
201st/ 347
METRIC RANK
97.9%
4TH GRADE
98.4/ 100
METRIC RATING
97th/ 347
METRIC RANK
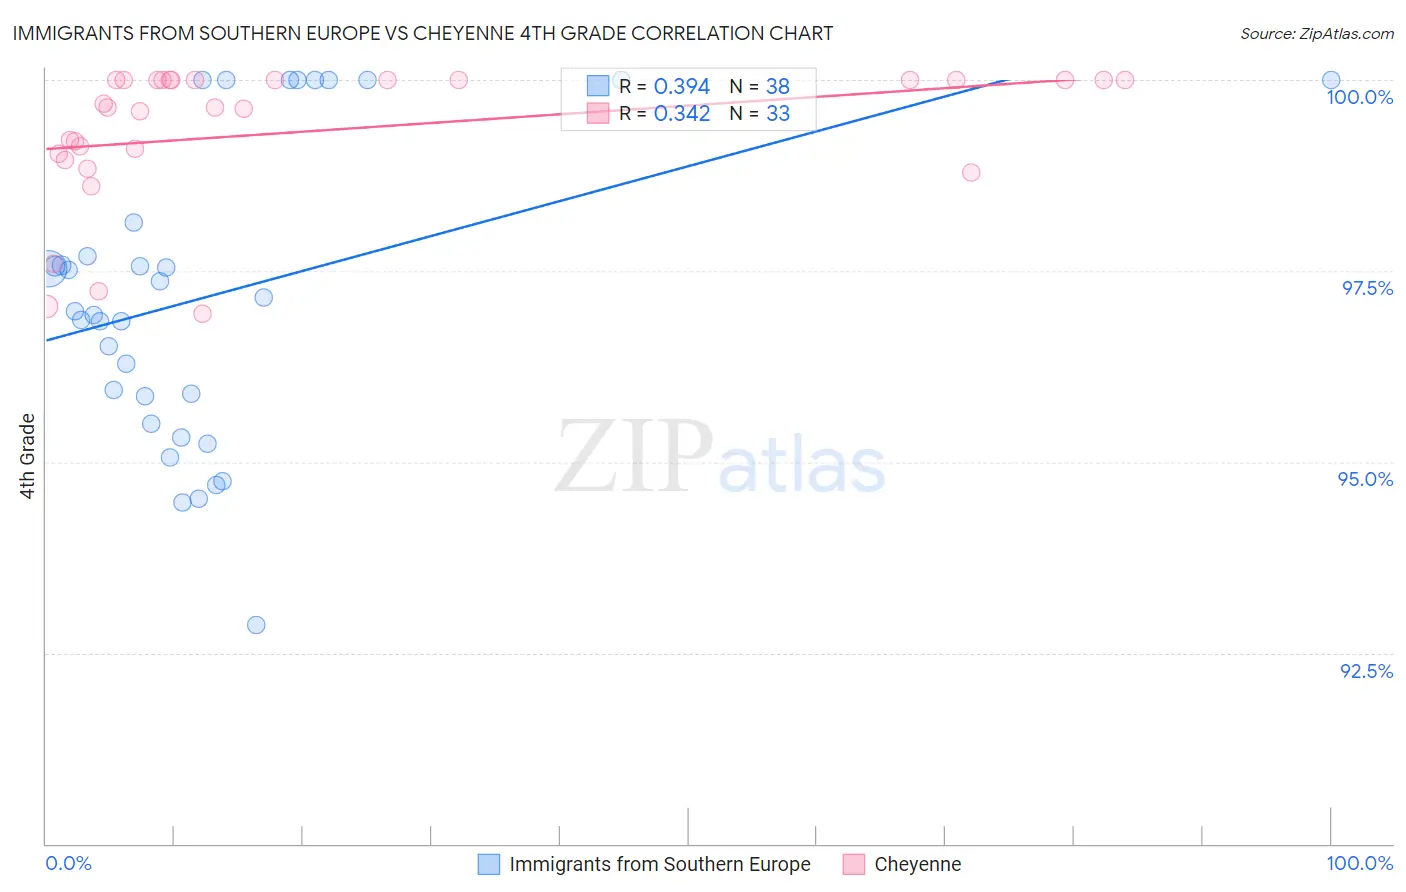
Immigrants from Southern Europe vs Cheyenne 4th Grade Correlation Chart
The statistical analysis conducted on geographies consisting of 402,804,595 people shows a mild positive correlation between the proportion of Immigrants from Southern Europe and percentage of population with at least 4th grade education in the United States with a correlation coefficient (R) of 0.394 and weighted average of 97.4%. Similarly, the statistical analysis conducted on geographies consisting of 80,716,760 people shows a mild positive correlation between the proportion of Cheyenne and percentage of population with at least 4th grade education in the United States with a correlation coefficient (R) of 0.342 and weighted average of 97.9%, a difference of 0.55%.
4th Grade Correlation Summary
| Measurement | Immigrants from Southern Europe | Cheyenne |
| Minimum | 92.9% | 96.9% |
| Maximum | 100.0% | 100.0% |
| Range | 7.1% | 3.1% |
| Mean | 97.2% | 99.3% |
| Median | 97.1% | 99.6% |
| Interquartile 25% (IQ1) | 95.9% | 99.0% |
| Interquartile 75% (IQ3) | 98.1% | 100.0% |
| Interquartile Range (IQR) | 2.3% | 1.0% |
| Standard Deviation (Sample) | 1.9% | 0.92% |
| Standard Deviation (Population) | 1.9% | 0.90% |
Similar Demographics by 4th Grade
Demographics Similar to Immigrants from Southern Europe by 4th Grade
In terms of 4th grade, the demographic groups most similar to Immigrants from Southern Europe are Immigrants from Chile (97.4%, a difference of 0.0%), Immigrants from Northern Africa (97.4%, a difference of 0.010%), African (97.4%, a difference of 0.010%), Immigrants from Uganda (97.4%, a difference of 0.020%), and Paiute (97.3%, a difference of 0.020%).
| Demographics | Rating | Rank | 4th Grade |
| Portuguese | 29.2 /100 | #194 | Fair 97.4% |
| Paraguayans | 28.9 /100 | #195 | Fair 97.4% |
| Immigrants | Albania | 27.7 /100 | #196 | Fair 97.4% |
| Hawaiians | 25.6 /100 | #197 | Fair 97.4% |
| Guamanians/Chamorros | 23.0 /100 | #198 | Fair 97.4% |
| Natives/Alaskans | 20.6 /100 | #199 | Fair 97.4% |
| Immigrants | Uganda | 19.8 /100 | #200 | Poor 97.4% |
| Immigrants | Southern Europe | 16.2 /100 | #201 | Poor 97.4% |
| Immigrants | Chile | 16.1 /100 | #202 | Poor 97.4% |
| Immigrants | Northern Africa | 15.1 /100 | #203 | Poor 97.4% |
| Africans | 14.6 /100 | #204 | Poor 97.4% |
| Paiute | 13.2 /100 | #205 | Poor 97.3% |
| Immigrants | Zaire | 12.8 /100 | #206 | Poor 97.3% |
| Moroccans | 11.3 /100 | #207 | Poor 97.3% |
| Immigrants | Bahamas | 10.8 /100 | #208 | Poor 97.3% |
Demographics Similar to Cheyenne by 4th Grade
In terms of 4th grade, the demographic groups most similar to Cheyenne are Romanian (97.9%, a difference of 0.0%), Immigrants from Germany (97.9%, a difference of 0.010%), South African (97.9%, a difference of 0.010%), Turkish (97.9%, a difference of 0.010%), and Yugoslavian (97.9%, a difference of 0.010%).
| Demographics | Rating | Rank | 4th Grade |
| Immigrants | Denmark | 98.7 /100 | #90 | Exceptional 97.9% |
| Immigrants | Sweden | 98.7 /100 | #91 | Exceptional 97.9% |
| Immigrants | Western Europe | 98.7 /100 | #92 | Exceptional 97.9% |
| Immigrants | Ireland | 98.7 /100 | #93 | Exceptional 97.9% |
| Shoshone | 98.7 /100 | #94 | Exceptional 97.9% |
| Immigrants | Germany | 98.5 /100 | #95 | Exceptional 97.9% |
| Romanians | 98.4 /100 | #96 | Exceptional 97.9% |
| Cheyenne | 98.4 /100 | #97 | Exceptional 97.9% |
| South Africans | 98.2 /100 | #98 | Exceptional 97.9% |
| Turks | 98.2 /100 | #99 | Exceptional 97.9% |
| Yugoslavians | 98.1 /100 | #100 | Exceptional 97.9% |
| Cree | 98.1 /100 | #101 | Exceptional 97.9% |
| Choctaw | 97.9 /100 | #102 | Exceptional 97.9% |
| Puget Sound Salish | 97.7 /100 | #103 | Exceptional 97.9% |
| Immigrants | Nonimmigrants | 97.5 /100 | #104 | Exceptional 97.9% |