Immigrants from St. Vincent and the Grenadines vs Belizean 4th Grade
COMPARE
Immigrants from St. Vincent and the Grenadines
Belizean
4th Grade
4th Grade Comparison
Immigrants from St. Vincent and the Grenadines
Belizeans
96.8%
4TH GRADE
0.1/ 100
METRIC RATING
284th/ 347
METRIC RANK
96.1%
4TH GRADE
0.0/ 100
METRIC RATING
319th/ 347
METRIC RANK
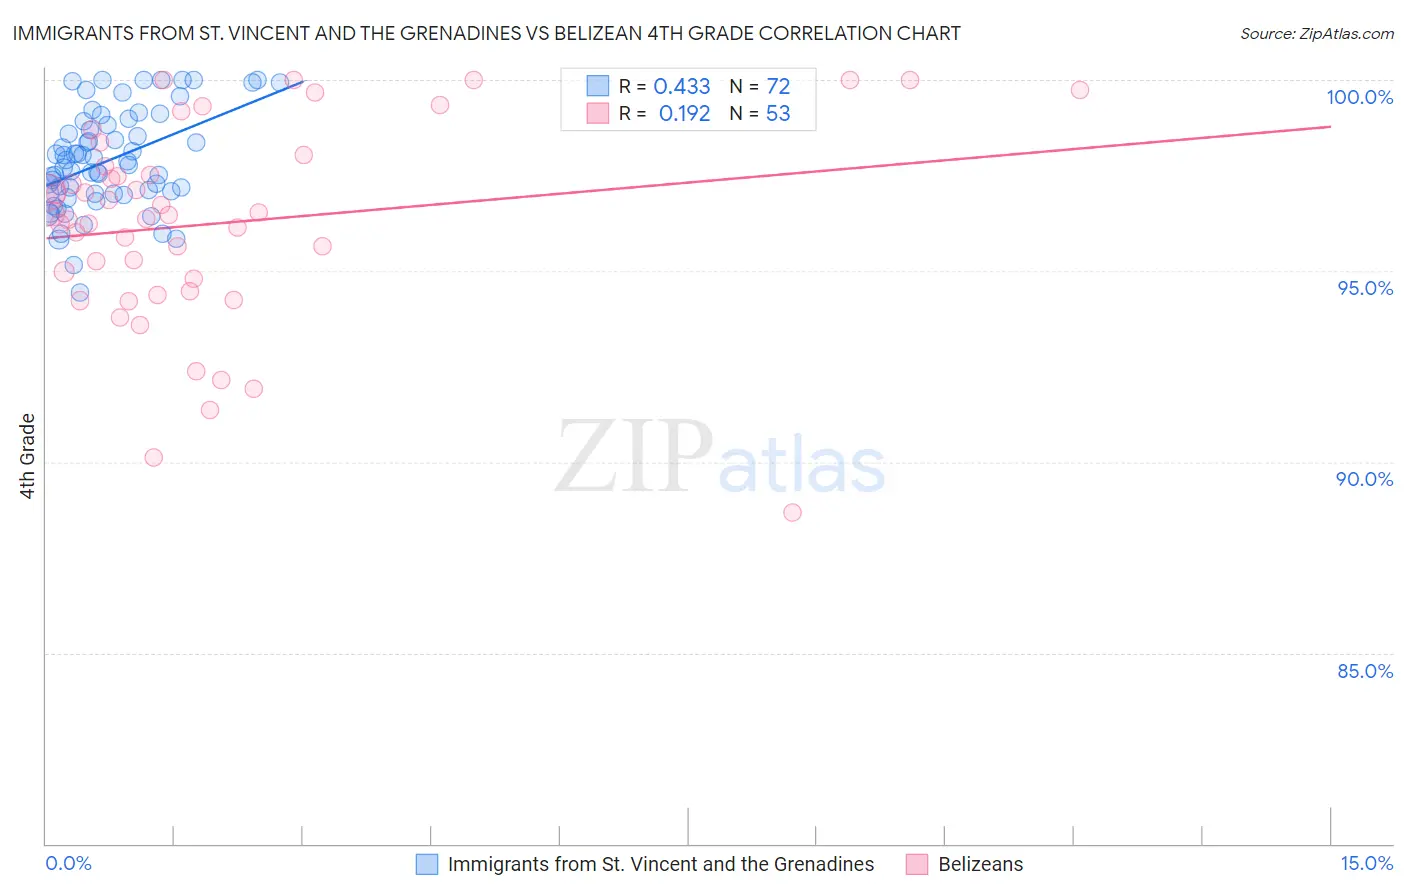
Immigrants from St. Vincent and the Grenadines vs Belizean 4th Grade Correlation Chart
The statistical analysis conducted on geographies consisting of 56,176,062 people shows a moderate positive correlation between the proportion of Immigrants from St. Vincent and the Grenadines and percentage of population with at least 4th grade education in the United States with a correlation coefficient (R) of 0.433 and weighted average of 96.8%. Similarly, the statistical analysis conducted on geographies consisting of 144,224,236 people shows a poor positive correlation between the proportion of Belizeans and percentage of population with at least 4th grade education in the United States with a correlation coefficient (R) of 0.192 and weighted average of 96.1%, a difference of 0.75%.
4th Grade Correlation Summary
| Measurement | Immigrants from St. Vincent and the Grenadines | Belizean |
| Minimum | 94.4% | 88.7% |
| Maximum | 100.0% | 100.0% |
| Range | 5.6% | 11.3% |
| Mean | 97.9% | 96.3% |
| Median | 97.8% | 96.5% |
| Interquartile 25% (IQ1) | 97.0% | 94.6% |
| Interquartile 75% (IQ3) | 98.9% | 97.9% |
| Interquartile Range (IQR) | 1.8% | 3.3% |
| Standard Deviation (Sample) | 1.3% | 2.6% |
| Standard Deviation (Population) | 1.3% | 2.6% |
Similar Demographics by 4th Grade
Demographics Similar to Immigrants from St. Vincent and the Grenadines by 4th Grade
In terms of 4th grade, the demographic groups most similar to Immigrants from St. Vincent and the Grenadines are Immigrants from Hong Kong (96.9%, a difference of 0.020%), Immigrants from Trinidad and Tobago (96.8%, a difference of 0.020%), Immigrants from Philippines (96.8%, a difference of 0.020%), Immigrants from Barbados (96.8%, a difference of 0.020%), and Immigrants from Thailand (96.8%, a difference of 0.030%).
| Demographics | Rating | Rank | 4th Grade |
| Immigrants | Western Africa | 0.1 /100 | #277 | Tragic 96.9% |
| Immigrants | Bolivia | 0.1 /100 | #278 | Tragic 96.9% |
| Afghans | 0.1 /100 | #279 | Tragic 96.9% |
| Barbadians | 0.1 /100 | #280 | Tragic 96.9% |
| Immigrants | Hong Kong | 0.1 /100 | #281 | Tragic 96.9% |
| Immigrants | Trinidad and Tobago | 0.1 /100 | #282 | Tragic 96.8% |
| Immigrants | Philippines | 0.1 /100 | #283 | Tragic 96.8% |
| Immigrants | St. Vincent and the Grenadines | 0.1 /100 | #284 | Tragic 96.8% |
| Immigrants | Barbados | 0.0 /100 | #285 | Tragic 96.8% |
| Immigrants | Thailand | 0.0 /100 | #286 | Tragic 96.8% |
| Houma | 0.0 /100 | #287 | Tragic 96.8% |
| Immigrants | Afghanistan | 0.0 /100 | #288 | Tragic 96.8% |
| Immigrants | West Indies | 0.0 /100 | #289 | Tragic 96.7% |
| British West Indians | 0.0 /100 | #290 | Tragic 96.7% |
| Immigrants | Grenada | 0.0 /100 | #291 | Tragic 96.7% |
Demographics Similar to Belizeans by 4th Grade
In terms of 4th grade, the demographic groups most similar to Belizeans are Bangladeshi (96.1%, a difference of 0.010%), Immigrants from the Azores (96.1%, a difference of 0.020%), Central American Indian (96.2%, a difference of 0.060%), Immigrants from Ecuador (96.2%, a difference of 0.10%), and Japanese (96.0%, a difference of 0.10%).
| Demographics | Rating | Rank | 4th Grade |
| Cape Verdeans | 0.0 /100 | #312 | Tragic 96.2% |
| Indonesians | 0.0 /100 | #313 | Tragic 96.2% |
| Vietnamese | 0.0 /100 | #314 | Tragic 96.2% |
| Nicaraguans | 0.0 /100 | #315 | Tragic 96.2% |
| Immigrants | Ecuador | 0.0 /100 | #316 | Tragic 96.2% |
| Central American Indians | 0.0 /100 | #317 | Tragic 96.2% |
| Immigrants | Azores | 0.0 /100 | #318 | Tragic 96.1% |
| Belizeans | 0.0 /100 | #319 | Tragic 96.1% |
| Bangladeshis | 0.0 /100 | #320 | Tragic 96.1% |
| Japanese | 0.0 /100 | #321 | Tragic 96.0% |
| Immigrants | Vietnam | 0.0 /100 | #322 | Tragic 96.0% |
| Immigrants | Nicaragua | 0.0 /100 | #323 | Tragic 96.0% |
| Immigrants | Belize | 0.0 /100 | #324 | Tragic 96.0% |
| Dominicans | 0.0 /100 | #325 | Tragic 96.0% |
| Hispanics or Latinos | 0.0 /100 | #326 | Tragic 96.0% |