Immigrants from Iran vs Belizean 4th Grade
COMPARE
Immigrants from Iran
Belizean
4th Grade
4th Grade Comparison
Immigrants from Iran
Belizeans
97.6%
4TH GRADE
60.3/ 100
METRIC RATING
163rd/ 347
METRIC RANK
96.1%
4TH GRADE
0.0/ 100
METRIC RATING
319th/ 347
METRIC RANK
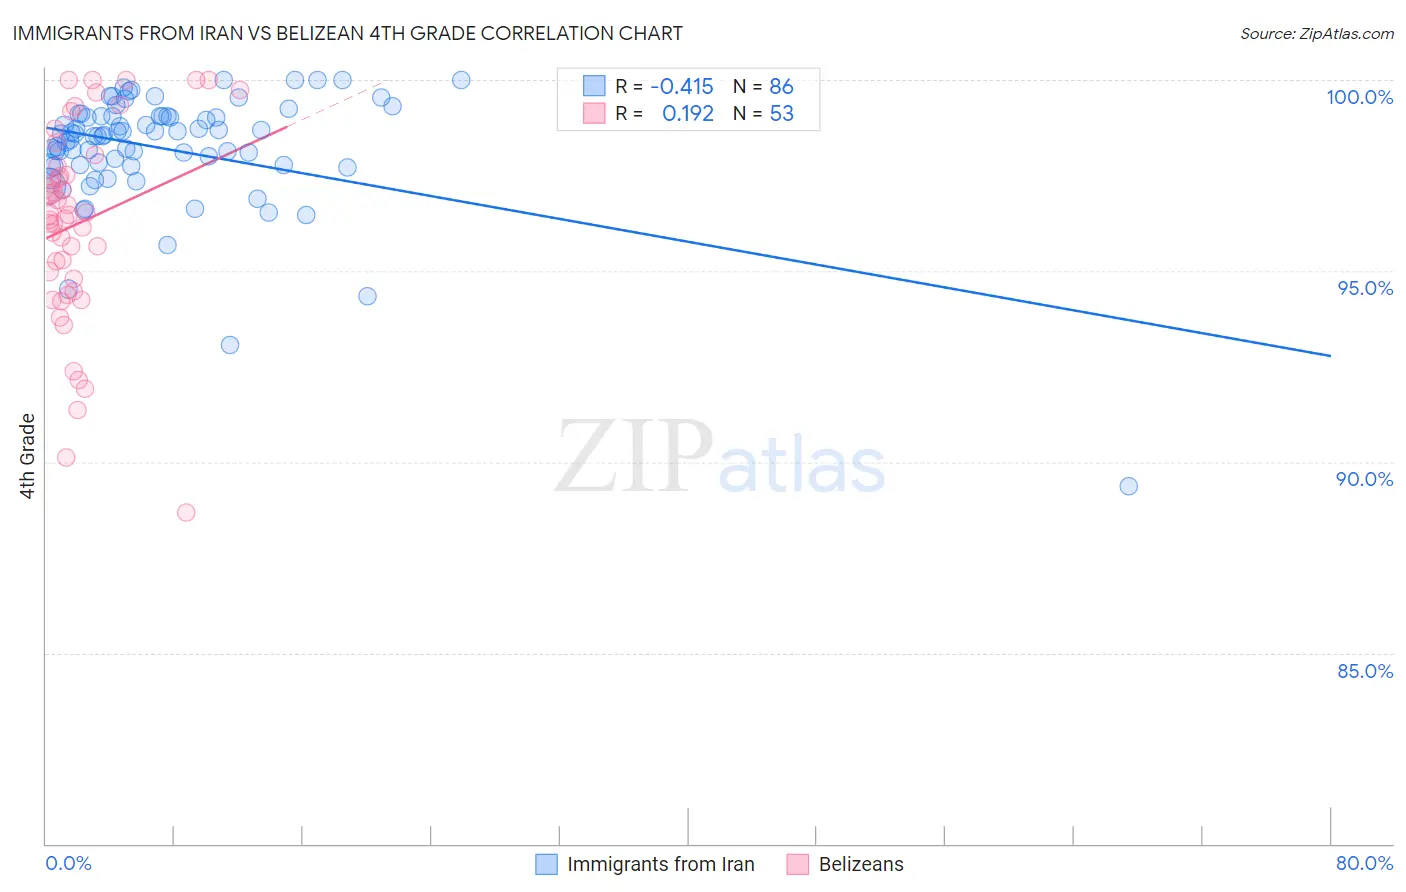
Immigrants from Iran vs Belizean 4th Grade Correlation Chart
The statistical analysis conducted on geographies consisting of 279,867,553 people shows a moderate negative correlation between the proportion of Immigrants from Iran and percentage of population with at least 4th grade education in the United States with a correlation coefficient (R) of -0.415 and weighted average of 97.6%. Similarly, the statistical analysis conducted on geographies consisting of 144,224,236 people shows a poor positive correlation between the proportion of Belizeans and percentage of population with at least 4th grade education in the United States with a correlation coefficient (R) of 0.192 and weighted average of 96.1%, a difference of 1.5%.
4th Grade Correlation Summary
| Measurement | Immigrants from Iran | Belizean |
| Minimum | 89.4% | 88.7% |
| Maximum | 100.0% | 100.0% |
| Range | 10.6% | 11.3% |
| Mean | 98.2% | 96.3% |
| Median | 98.6% | 96.5% |
| Interquartile 25% (IQ1) | 97.8% | 94.6% |
| Interquartile 75% (IQ3) | 99.0% | 97.9% |
| Interquartile Range (IQR) | 1.3% | 3.3% |
| Standard Deviation (Sample) | 1.6% | 2.6% |
| Standard Deviation (Population) | 1.6% | 2.6% |
Similar Demographics by 4th Grade
Demographics Similar to Immigrants from Iran by 4th Grade
In terms of 4th grade, the demographic groups most similar to Immigrants from Iran are Apache (97.6%, a difference of 0.0%), Marshallese (97.6%, a difference of 0.0%), Bermudan (97.6%, a difference of 0.0%), Immigrants from Italy (97.6%, a difference of 0.010%), and Ugandan (97.6%, a difference of 0.010%).
| Demographics | Rating | Rank | 4th Grade |
| Immigrants | Jordan | 66.9 /100 | #156 | Good 97.6% |
| Immigrants | Bosnia and Herzegovina | 66.0 /100 | #157 | Good 97.6% |
| French American Indians | 65.9 /100 | #158 | Good 97.6% |
| Immigrants | Italy | 63.7 /100 | #159 | Good 97.6% |
| Apache | 61.3 /100 | #160 | Good 97.6% |
| Marshallese | 60.8 /100 | #161 | Good 97.6% |
| Bermudans | 60.5 /100 | #162 | Good 97.6% |
| Immigrants | Iran | 60.3 /100 | #163 | Good 97.6% |
| Ugandans | 58.9 /100 | #164 | Average 97.6% |
| Venezuelans | 58.7 /100 | #165 | Average 97.6% |
| Kenyans | 56.5 /100 | #166 | Average 97.5% |
| Immigrants | Poland | 55.9 /100 | #167 | Average 97.5% |
| Immigrants | Belarus | 55.8 /100 | #168 | Average 97.5% |
| Chileans | 54.4 /100 | #169 | Average 97.5% |
| Immigrants | Spain | 51.8 /100 | #170 | Average 97.5% |
Demographics Similar to Belizeans by 4th Grade
In terms of 4th grade, the demographic groups most similar to Belizeans are Bangladeshi (96.1%, a difference of 0.010%), Immigrants from the Azores (96.1%, a difference of 0.020%), Central American Indian (96.2%, a difference of 0.060%), Immigrants from Ecuador (96.2%, a difference of 0.10%), and Japanese (96.0%, a difference of 0.10%).
| Demographics | Rating | Rank | 4th Grade |
| Cape Verdeans | 0.0 /100 | #312 | Tragic 96.2% |
| Indonesians | 0.0 /100 | #313 | Tragic 96.2% |
| Vietnamese | 0.0 /100 | #314 | Tragic 96.2% |
| Nicaraguans | 0.0 /100 | #315 | Tragic 96.2% |
| Immigrants | Ecuador | 0.0 /100 | #316 | Tragic 96.2% |
| Central American Indians | 0.0 /100 | #317 | Tragic 96.2% |
| Immigrants | Azores | 0.0 /100 | #318 | Tragic 96.1% |
| Belizeans | 0.0 /100 | #319 | Tragic 96.1% |
| Bangladeshis | 0.0 /100 | #320 | Tragic 96.1% |
| Japanese | 0.0 /100 | #321 | Tragic 96.0% |
| Immigrants | Vietnam | 0.0 /100 | #322 | Tragic 96.0% |
| Immigrants | Nicaragua | 0.0 /100 | #323 | Tragic 96.0% |
| Immigrants | Belize | 0.0 /100 | #324 | Tragic 96.0% |
| Dominicans | 0.0 /100 | #325 | Tragic 96.0% |
| Hispanics or Latinos | 0.0 /100 | #326 | Tragic 96.0% |