Immigrants from Hungary vs Belizean 4th Grade
COMPARE
Immigrants from Hungary
Belizean
4th Grade
4th Grade Comparison
Immigrants from Hungary
Belizeans
97.7%
4TH GRADE
89.3/ 100
METRIC RATING
132nd/ 347
METRIC RANK
96.1%
4TH GRADE
0.0/ 100
METRIC RATING
319th/ 347
METRIC RANK
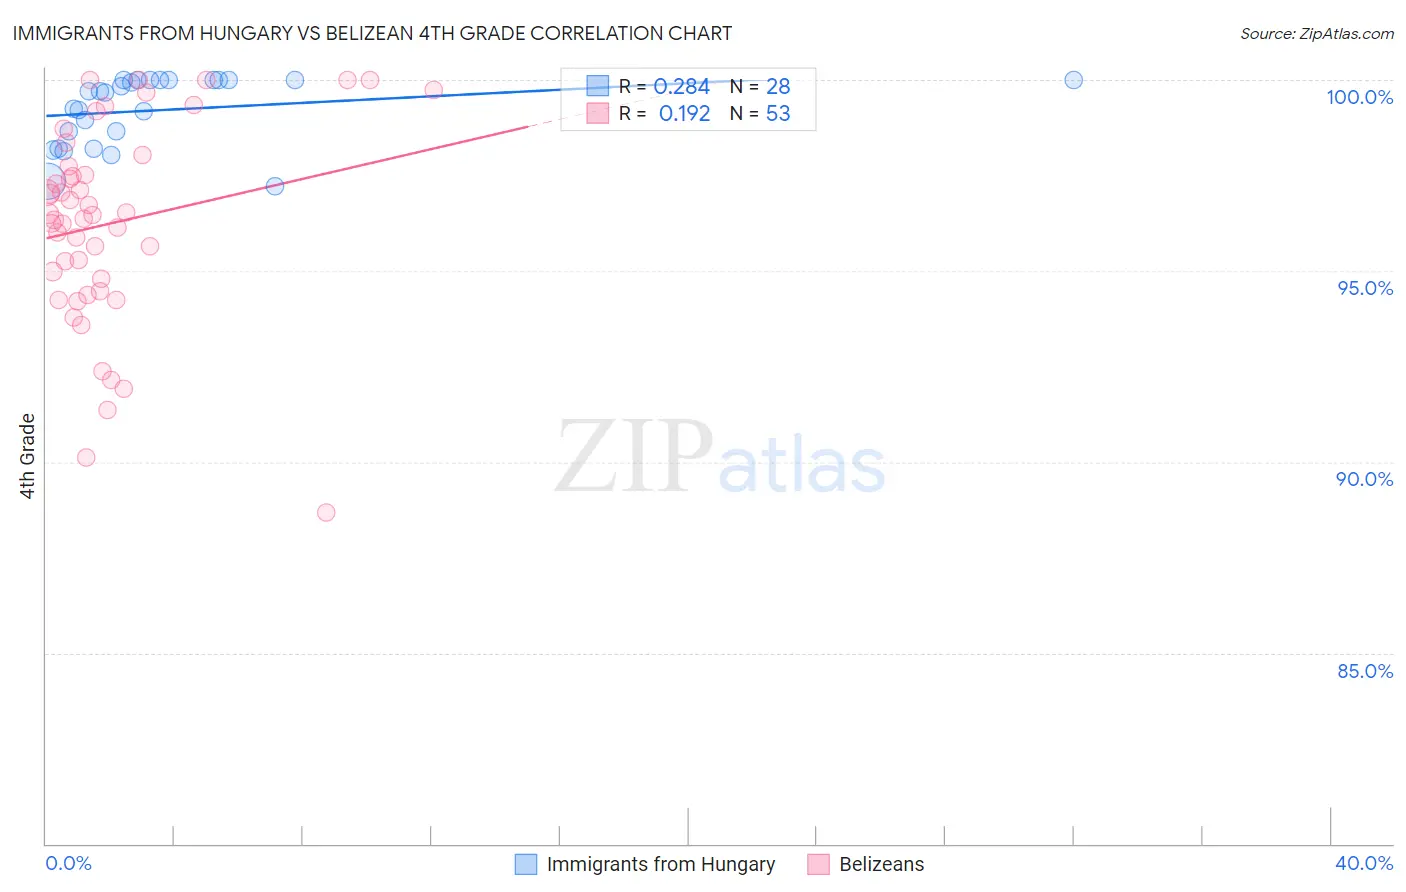
Immigrants from Hungary vs Belizean 4th Grade Correlation Chart
The statistical analysis conducted on geographies consisting of 195,707,305 people shows a weak positive correlation between the proportion of Immigrants from Hungary and percentage of population with at least 4th grade education in the United States with a correlation coefficient (R) of 0.284 and weighted average of 97.7%. Similarly, the statistical analysis conducted on geographies consisting of 144,224,236 people shows a poor positive correlation between the proportion of Belizeans and percentage of population with at least 4th grade education in the United States with a correlation coefficient (R) of 0.192 and weighted average of 96.1%, a difference of 1.7%.
4th Grade Correlation Summary
| Measurement | Immigrants from Hungary | Belizean |
| Minimum | 97.2% | 88.7% |
| Maximum | 100.0% | 100.0% |
| Range | 2.8% | 11.3% |
| Mean | 99.2% | 96.3% |
| Median | 99.7% | 96.5% |
| Interquartile 25% (IQ1) | 98.4% | 94.6% |
| Interquartile 75% (IQ3) | 100.0% | 97.9% |
| Interquartile Range (IQR) | 1.6% | 3.3% |
| Standard Deviation (Sample) | 0.89% | 2.6% |
| Standard Deviation (Population) | 0.88% | 2.6% |
Similar Demographics by 4th Grade
Demographics Similar to Immigrants from Hungary by 4th Grade
In terms of 4th grade, the demographic groups most similar to Immigrants from Hungary are Immigrants from Kuwait (97.7%, a difference of 0.0%), Immigrants from Romania (97.7%, a difference of 0.010%), Hmong (97.7%, a difference of 0.010%), Palestinian (97.7%, a difference of 0.010%), and Cambodian (97.7%, a difference of 0.010%).
| Demographics | Rating | Rank | 4th Grade |
| Immigrants | Serbia | 92.6 /100 | #125 | Exceptional 97.8% |
| Immigrants | Europe | 92.5 /100 | #126 | Exceptional 97.8% |
| Colville | 92.3 /100 | #127 | Exceptional 97.7% |
| Pima | 92.0 /100 | #128 | Exceptional 97.7% |
| Immigrants | Bulgaria | 91.3 /100 | #129 | Exceptional 97.7% |
| Immigrants | Romania | 90.6 /100 | #130 | Exceptional 97.7% |
| Immigrants | Kuwait | 89.7 /100 | #131 | Excellent 97.7% |
| Immigrants | Hungary | 89.3 /100 | #132 | Excellent 97.7% |
| Hmong | 88.2 /100 | #133 | Excellent 97.7% |
| Palestinians | 88.1 /100 | #134 | Excellent 97.7% |
| Cambodians | 87.8 /100 | #135 | Excellent 97.7% |
| Israelis | 86.2 /100 | #136 | Excellent 97.7% |
| Immigrants | Turkey | 86.0 /100 | #137 | Excellent 97.7% |
| Blackfeet | 86.0 /100 | #138 | Excellent 97.7% |
| Seminole | 84.7 /100 | #139 | Excellent 97.7% |
Demographics Similar to Belizeans by 4th Grade
In terms of 4th grade, the demographic groups most similar to Belizeans are Bangladeshi (96.1%, a difference of 0.010%), Immigrants from the Azores (96.1%, a difference of 0.020%), Central American Indian (96.2%, a difference of 0.060%), Immigrants from Ecuador (96.2%, a difference of 0.10%), and Japanese (96.0%, a difference of 0.10%).
| Demographics | Rating | Rank | 4th Grade |
| Cape Verdeans | 0.0 /100 | #312 | Tragic 96.2% |
| Indonesians | 0.0 /100 | #313 | Tragic 96.2% |
| Vietnamese | 0.0 /100 | #314 | Tragic 96.2% |
| Nicaraguans | 0.0 /100 | #315 | Tragic 96.2% |
| Immigrants | Ecuador | 0.0 /100 | #316 | Tragic 96.2% |
| Central American Indians | 0.0 /100 | #317 | Tragic 96.2% |
| Immigrants | Azores | 0.0 /100 | #318 | Tragic 96.1% |
| Belizeans | 0.0 /100 | #319 | Tragic 96.1% |
| Bangladeshis | 0.0 /100 | #320 | Tragic 96.1% |
| Japanese | 0.0 /100 | #321 | Tragic 96.0% |
| Immigrants | Vietnam | 0.0 /100 | #322 | Tragic 96.0% |
| Immigrants | Nicaragua | 0.0 /100 | #323 | Tragic 96.0% |
| Immigrants | Belize | 0.0 /100 | #324 | Tragic 96.0% |
| Dominicans | 0.0 /100 | #325 | Tragic 96.0% |
| Hispanics or Latinos | 0.0 /100 | #326 | Tragic 96.0% |