Immigrants from Norway vs Immigrants from Uzbekistan College, Under 1 year
COMPARE
Immigrants from Norway
Immigrants from Uzbekistan
College, Under 1 year
College, Under 1 year Comparison
Immigrants from Norway
Immigrants from Uzbekistan
70.2%
COLLEGE, UNDER 1 YEAR
99.9/ 100
METRIC RATING
45th/ 347
METRIC RANK
65.8%
COLLEGE, UNDER 1 YEAR
61.6/ 100
METRIC RATING
165th/ 347
METRIC RANK
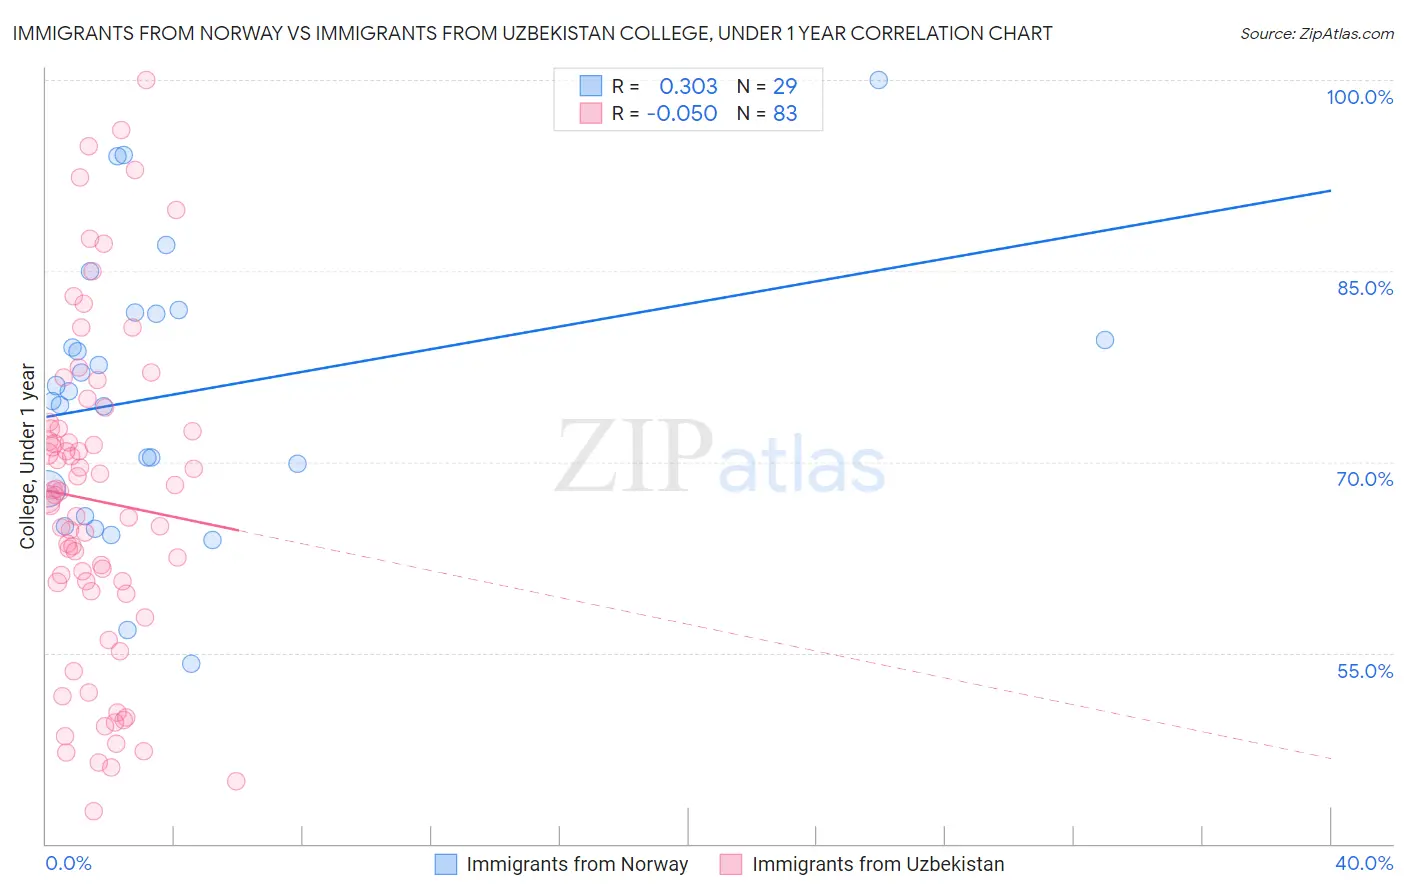
Immigrants from Norway vs Immigrants from Uzbekistan College, Under 1 year Correlation Chart
The statistical analysis conducted on geographies consisting of 116,716,420 people shows a mild positive correlation between the proportion of Immigrants from Norway and percentage of population with at least college, under 1 year education in the United States with a correlation coefficient (R) of 0.303 and weighted average of 70.2%. Similarly, the statistical analysis conducted on geographies consisting of 118,765,305 people shows no correlation between the proportion of Immigrants from Uzbekistan and percentage of population with at least college, under 1 year education in the United States with a correlation coefficient (R) of -0.050 and weighted average of 65.8%, a difference of 6.8%.
College, Under 1 year Correlation Summary
| Measurement | Immigrants from Norway | Immigrants from Uzbekistan |
| Minimum | 54.2% | 42.6% |
| Maximum | 100.0% | 100.0% |
| Range | 45.8% | 57.4% |
| Mean | 75.4% | 67.0% |
| Median | 75.5% | 67.4% |
| Interquartile 25% (IQ1) | 66.8% | 59.9% |
| Interquartile 75% (IQ3) | 81.7% | 72.6% |
| Interquartile Range (IQR) | 14.9% | 12.7% |
| Standard Deviation (Sample) | 10.7% | 12.9% |
| Standard Deviation (Population) | 10.5% | 12.9% |
Similar Demographics by College, Under 1 year
Demographics Similar to Immigrants from Norway by College, Under 1 year
In terms of college, under 1 year, the demographic groups most similar to Immigrants from Norway are Israeli (70.2%, a difference of 0.020%), New Zealander (70.2%, a difference of 0.020%), Immigrants from Lithuania (70.3%, a difference of 0.090%), Immigrants from Latvia (70.1%, a difference of 0.12%), and Immigrants from Kuwait (70.3%, a difference of 0.14%).
| Demographics | Rating | Rank | College, Under 1 year |
| Australians | 99.9 /100 | #38 | Exceptional 70.4% |
| Bhutanese | 99.9 /100 | #39 | Exceptional 70.3% |
| Immigrants | Turkey | 99.9 /100 | #40 | Exceptional 70.3% |
| Immigrants | Kuwait | 99.9 /100 | #41 | Exceptional 70.3% |
| Immigrants | Lithuania | 99.9 /100 | #42 | Exceptional 70.3% |
| Israelis | 99.9 /100 | #43 | Exceptional 70.2% |
| New Zealanders | 99.9 /100 | #44 | Exceptional 70.2% |
| Immigrants | Norway | 99.9 /100 | #45 | Exceptional 70.2% |
| Immigrants | Latvia | 99.9 /100 | #46 | Exceptional 70.1% |
| Immigrants | Bulgaria | 99.8 /100 | #47 | Exceptional 70.0% |
| Immigrants | Netherlands | 99.8 /100 | #48 | Exceptional 70.0% |
| Immigrants | Austria | 99.8 /100 | #49 | Exceptional 70.0% |
| Zimbabweans | 99.8 /100 | #50 | Exceptional 69.9% |
| Mongolians | 99.8 /100 | #51 | Exceptional 69.9% |
| Immigrants | Russia | 99.8 /100 | #52 | Exceptional 69.9% |
Demographics Similar to Immigrants from Uzbekistan by College, Under 1 year
In terms of college, under 1 year, the demographic groups most similar to Immigrants from Uzbekistan are Somali (65.8%, a difference of 0.050%), Czechoslovakian (65.8%, a difference of 0.050%), Korean (65.9%, a difference of 0.17%), Brazilian (65.9%, a difference of 0.21%), and Albanian (65.9%, a difference of 0.22%).
| Demographics | Rating | Rank | College, Under 1 year |
| Celtics | 67.3 /100 | #158 | Good 65.9% |
| Tlingit-Haida | 66.4 /100 | #159 | Good 65.9% |
| Albanians | 66.1 /100 | #160 | Good 65.9% |
| Brazilians | 66.0 /100 | #161 | Good 65.9% |
| Koreans | 65.3 /100 | #162 | Good 65.9% |
| Somalis | 62.7 /100 | #163 | Good 65.8% |
| Czechoslovakians | 62.6 /100 | #164 | Good 65.8% |
| Immigrants | Uzbekistan | 61.6 /100 | #165 | Good 65.8% |
| Moroccans | 56.7 /100 | #166 | Average 65.6% |
| Immigrants | Somalia | 56.4 /100 | #167 | Average 65.6% |
| Hungarians | 55.9 /100 | #168 | Average 65.6% |
| Yugoslavians | 55.7 /100 | #169 | Average 65.6% |
| Germans | 55.7 /100 | #170 | Average 65.6% |
| Immigrants | Oceania | 55.0 /100 | #171 | Average 65.6% |
| South American Indians | 54.4 /100 | #172 | Average 65.5% |