Immigrants vs Immigrants from Uzbekistan College, Under 1 year
COMPARE
Immigrants
Immigrants from Uzbekistan
College, Under 1 year
College, Under 1 year Comparison
Immigrants
Immigrants from Uzbekistan
62.5%
COLLEGE, UNDER 1 YEAR
1.7/ 100
METRIC RATING
236th/ 347
METRIC RANK
65.8%
COLLEGE, UNDER 1 YEAR
61.6/ 100
METRIC RATING
165th/ 347
METRIC RANK
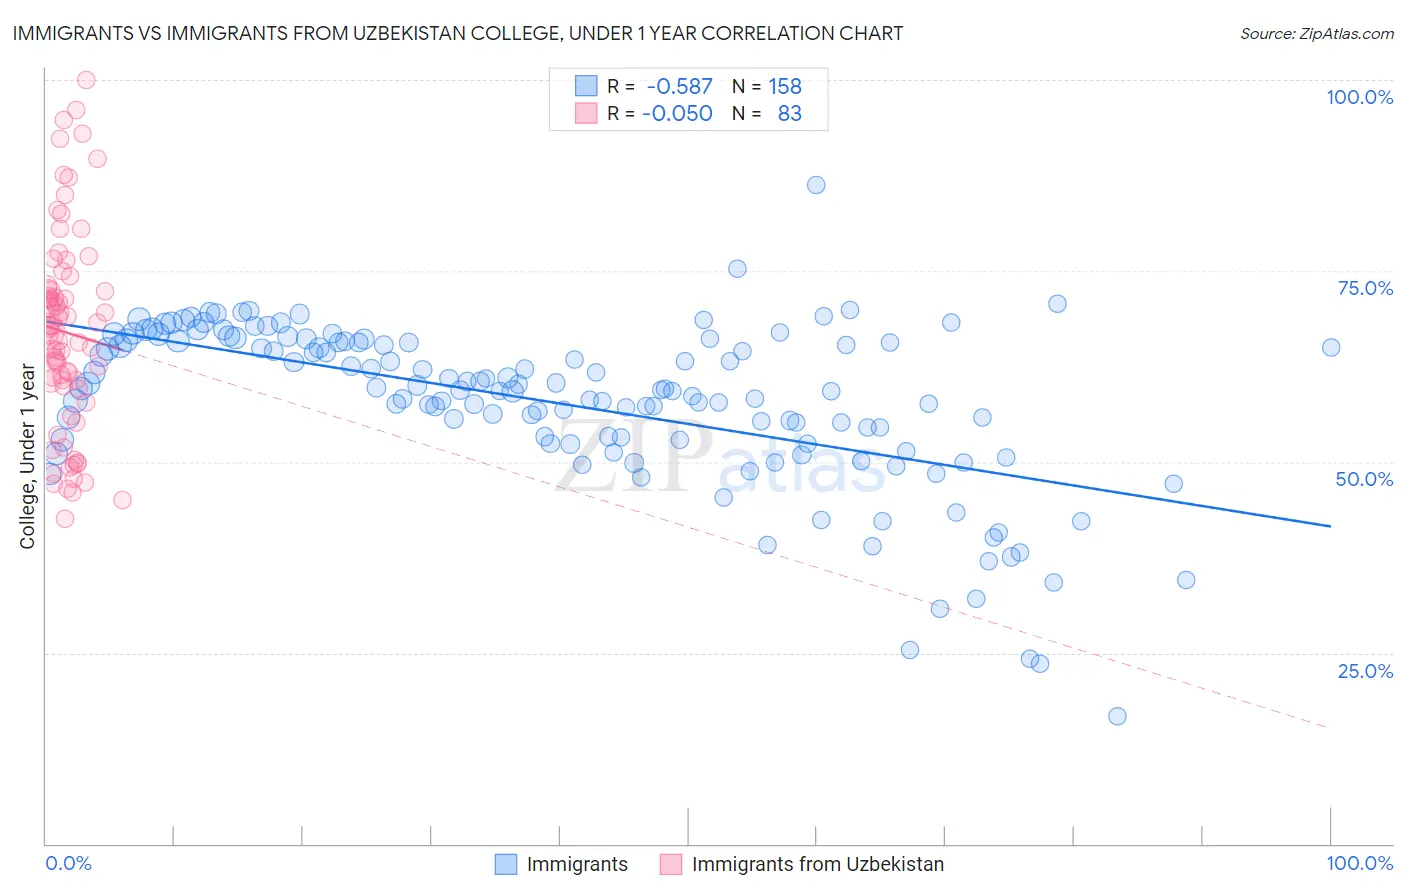
Immigrants vs Immigrants from Uzbekistan College, Under 1 year Correlation Chart
The statistical analysis conducted on geographies consisting of 577,770,427 people shows a substantial negative correlation between the proportion of Immigrants and percentage of population with at least college, under 1 year education in the United States with a correlation coefficient (R) of -0.587 and weighted average of 62.5%. Similarly, the statistical analysis conducted on geographies consisting of 118,765,305 people shows no correlation between the proportion of Immigrants from Uzbekistan and percentage of population with at least college, under 1 year education in the United States with a correlation coefficient (R) of -0.050 and weighted average of 65.8%, a difference of 5.2%.
College, Under 1 year Correlation Summary
| Measurement | Immigrants | Immigrants from Uzbekistan |
| Minimum | 16.7% | 42.6% |
| Maximum | 86.3% | 100.0% |
| Range | 69.7% | 57.4% |
| Mean | 57.6% | 67.0% |
| Median | 59.4% | 67.4% |
| Interquartile 25% (IQ1) | 52.9% | 59.9% |
| Interquartile 75% (IQ3) | 65.7% | 72.6% |
| Interquartile Range (IQR) | 12.8% | 12.7% |
| Standard Deviation (Sample) | 10.9% | 12.9% |
| Standard Deviation (Population) | 10.8% | 12.9% |
Similar Demographics by College, Under 1 year
Demographics Similar to Immigrants by College, Under 1 year
In terms of college, under 1 year, the demographic groups most similar to Immigrants are Immigrants from Burma/Myanmar (62.5%, a difference of 0.030%), French American Indian (62.4%, a difference of 0.12%), Spanish American (62.6%, a difference of 0.13%), Chippewa (62.6%, a difference of 0.18%), and Iroquois (62.6%, a difference of 0.21%).
| Demographics | Rating | Rank | College, Under 1 year |
| Liberians | 3.2 /100 | #229 | Tragic 63.0% |
| Immigrants | Nonimmigrants | 3.0 /100 | #230 | Tragic 62.9% |
| Immigrants | Western Africa | 2.4 /100 | #231 | Tragic 62.8% |
| Osage | 2.2 /100 | #232 | Tragic 62.7% |
| Iroquois | 2.0 /100 | #233 | Tragic 62.6% |
| Chippewa | 2.0 /100 | #234 | Tragic 62.6% |
| Spanish Americans | 1.9 /100 | #235 | Tragic 62.6% |
| Immigrants | Immigrants | 1.7 /100 | #236 | Tragic 62.5% |
| Immigrants | Burma/Myanmar | 1.6 /100 | #237 | Tragic 62.5% |
| French American Indians | 1.5 /100 | #238 | Tragic 62.4% |
| Nepalese | 1.1 /100 | #239 | Tragic 62.2% |
| Aleuts | 1.1 /100 | #240 | Tragic 62.2% |
| Ottawa | 1.1 /100 | #241 | Tragic 62.2% |
| Malaysians | 1.1 /100 | #242 | Tragic 62.2% |
| Hawaiians | 1.1 /100 | #243 | Tragic 62.1% |
Demographics Similar to Immigrants from Uzbekistan by College, Under 1 year
In terms of college, under 1 year, the demographic groups most similar to Immigrants from Uzbekistan are Somali (65.8%, a difference of 0.050%), Czechoslovakian (65.8%, a difference of 0.050%), Korean (65.9%, a difference of 0.17%), Brazilian (65.9%, a difference of 0.21%), and Albanian (65.9%, a difference of 0.22%).
| Demographics | Rating | Rank | College, Under 1 year |
| Celtics | 67.3 /100 | #158 | Good 65.9% |
| Tlingit-Haida | 66.4 /100 | #159 | Good 65.9% |
| Albanians | 66.1 /100 | #160 | Good 65.9% |
| Brazilians | 66.0 /100 | #161 | Good 65.9% |
| Koreans | 65.3 /100 | #162 | Good 65.9% |
| Somalis | 62.7 /100 | #163 | Good 65.8% |
| Czechoslovakians | 62.6 /100 | #164 | Good 65.8% |
| Immigrants | Uzbekistan | 61.6 /100 | #165 | Good 65.8% |
| Moroccans | 56.7 /100 | #166 | Average 65.6% |
| Immigrants | Somalia | 56.4 /100 | #167 | Average 65.6% |
| Hungarians | 55.9 /100 | #168 | Average 65.6% |
| Yugoslavians | 55.7 /100 | #169 | Average 65.6% |
| Germans | 55.7 /100 | #170 | Average 65.6% |
| Immigrants | Oceania | 55.0 /100 | #171 | Average 65.6% |
| South American Indians | 54.4 /100 | #172 | Average 65.5% |