Immigrants from Russia vs Immigrants from Panama 8th Grade
COMPARE
Immigrants from Russia
Immigrants from Panama
8th Grade
8th Grade Comparison
Immigrants from Russia
Immigrants from Panama
96.0%
8TH GRADE
80.9/ 100
METRIC RATING
150th/ 347
METRIC RANK
95.2%
8TH GRADE
4.1/ 100
METRIC RATING
230th/ 347
METRIC RANK
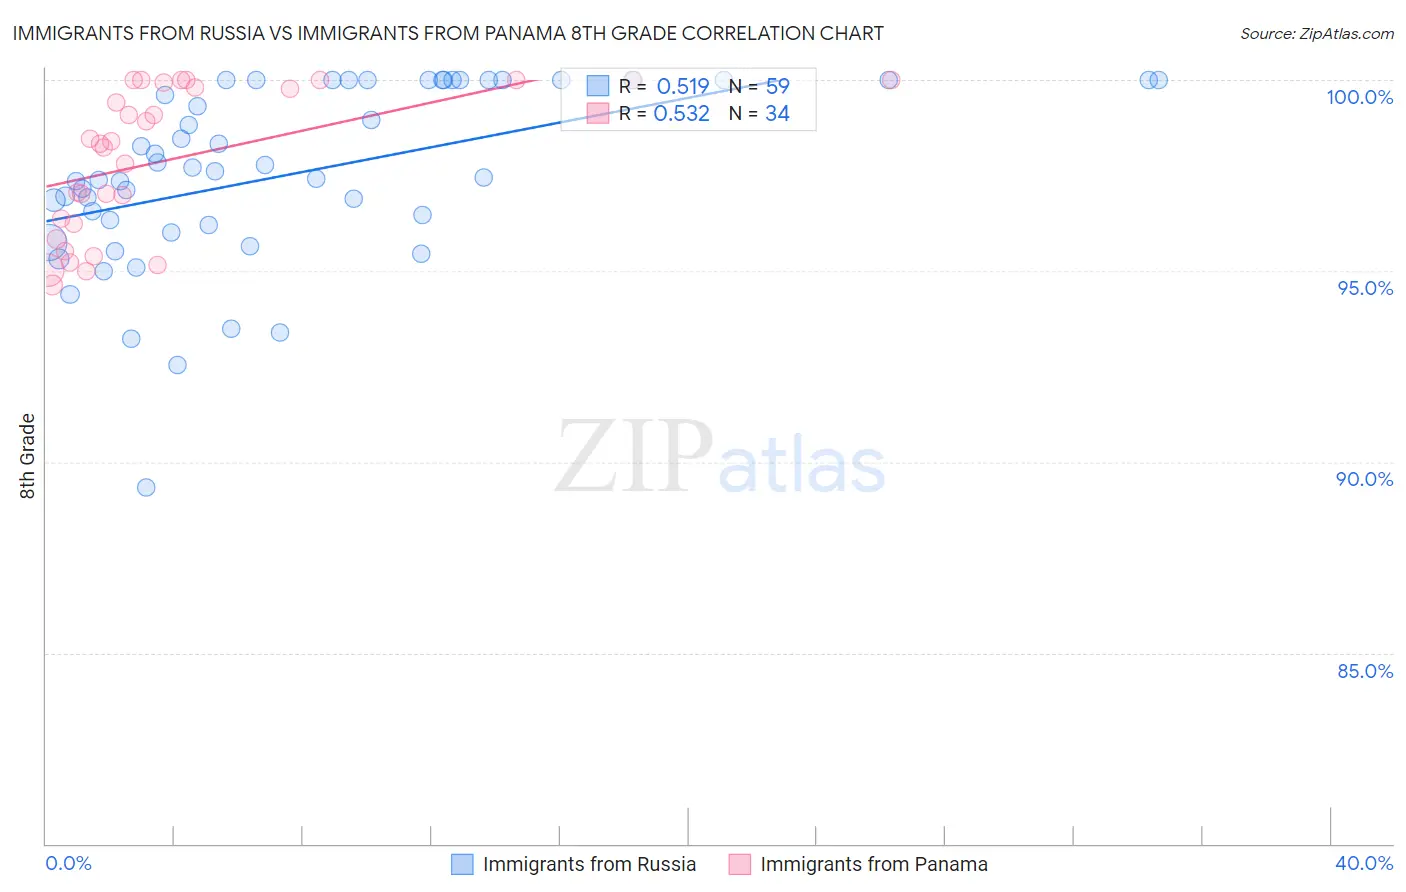
Immigrants from Russia vs Immigrants from Panama 8th Grade Correlation Chart
The statistical analysis conducted on geographies consisting of 347,948,494 people shows a substantial positive correlation between the proportion of Immigrants from Russia and percentage of population with at least 8th grade education in the United States with a correlation coefficient (R) of 0.519 and weighted average of 96.0%. Similarly, the statistical analysis conducted on geographies consisting of 221,181,539 people shows a substantial positive correlation between the proportion of Immigrants from Panama and percentage of population with at least 8th grade education in the United States with a correlation coefficient (R) of 0.532 and weighted average of 95.2%, a difference of 0.75%.
8th Grade Correlation Summary
| Measurement | Immigrants from Russia | Immigrants from Panama |
| Minimum | 89.3% | 94.6% |
| Maximum | 100.0% | 100.0% |
| Range | 10.7% | 5.4% |
| Mean | 97.5% | 97.9% |
| Median | 97.6% | 98.4% |
| Interquartile 25% (IQ1) | 96.2% | 96.2% |
| Interquartile 75% (IQ3) | 100.0% | 99.9% |
| Interquartile Range (IQR) | 3.8% | 3.7% |
| Standard Deviation (Sample) | 2.3% | 1.9% |
| Standard Deviation (Population) | 2.3% | 1.9% |
Similar Demographics by 8th Grade
Demographics Similar to Immigrants from Russia by 8th Grade
In terms of 8th grade, the demographic groups most similar to Immigrants from Russia are Immigrants from Israel (96.0%, a difference of 0.0%), Blackfeet (96.0%, a difference of 0.0%), French American Indian (96.0%, a difference of 0.0%), Immigrants from Jordan (95.9%, a difference of 0.010%), and Albanian (96.0%, a difference of 0.020%).
| Demographics | Rating | Rank | 8th Grade |
| Spanish | 85.1 /100 | #143 | Excellent 96.0% |
| Immigrants | Belarus | 84.8 /100 | #144 | Excellent 96.0% |
| Lumbee | 84.1 /100 | #145 | Excellent 96.0% |
| Israelis | 84.1 /100 | #146 | Excellent 96.0% |
| Colville | 84.0 /100 | #147 | Excellent 96.0% |
| Albanians | 83.1 /100 | #148 | Excellent 96.0% |
| Immigrants | Israel | 81.3 /100 | #149 | Excellent 96.0% |
| Immigrants | Russia | 80.9 /100 | #150 | Excellent 96.0% |
| Blackfeet | 80.8 /100 | #151 | Excellent 96.0% |
| French American Indians | 80.6 /100 | #152 | Excellent 96.0% |
| Immigrants | Jordan | 79.5 /100 | #153 | Good 95.9% |
| Hopi | 79.4 /100 | #154 | Good 95.9% |
| Kenyans | 74.5 /100 | #155 | Good 95.9% |
| Ugandans | 74.1 /100 | #156 | Good 95.9% |
| Immigrants | Taiwan | 70.5 /100 | #157 | Good 95.9% |
Demographics Similar to Immigrants from Panama by 8th Grade
In terms of 8th grade, the demographic groups most similar to Immigrants from Panama are Immigrants from Indonesia (95.3%, a difference of 0.010%), Asian (95.2%, a difference of 0.030%), Indian (Asian) (95.2%, a difference of 0.030%), Bahamian (95.3%, a difference of 0.050%), and Immigrants from Eastern Africa (95.3%, a difference of 0.050%).
| Demographics | Rating | Rank | 8th Grade |
| Immigrants | Oceania | 7.1 /100 | #223 | Tragic 95.3% |
| Immigrants | Western Asia | 6.0 /100 | #224 | Tragic 95.3% |
| Sub-Saharan Africans | 6.0 /100 | #225 | Tragic 95.3% |
| Navajo | 5.7 /100 | #226 | Tragic 95.3% |
| Bahamians | 5.6 /100 | #227 | Tragic 95.3% |
| Immigrants | Eastern Africa | 5.6 /100 | #228 | Tragic 95.3% |
| Immigrants | Indonesia | 4.4 /100 | #229 | Tragic 95.3% |
| Immigrants | Panama | 4.1 /100 | #230 | Tragic 95.2% |
| Asians | 3.5 /100 | #231 | Tragic 95.2% |
| Indians (Asian) | 3.3 /100 | #232 | Tragic 95.2% |
| Immigrants | Asia | 3.1 /100 | #233 | Tragic 95.2% |
| Costa Ricans | 3.0 /100 | #234 | Tragic 95.2% |
| Nigerians | 2.9 /100 | #235 | Tragic 95.2% |
| Senegalese | 2.7 /100 | #236 | Tragic 95.2% |
| Immigrants | Africa | 2.7 /100 | #237 | Tragic 95.2% |