Ottawa vs Immigrants from Latvia 10th Grade
COMPARE
Ottawa
Immigrants from Latvia
10th Grade
10th Grade Comparison
Ottawa
Immigrants from Latvia
95.1%
10TH GRADE
99.8/ 100
METRIC RATING
52nd/ 347
METRIC RANK
94.7%
10TH GRADE
99.2/ 100
METRIC RATING
81st/ 347
METRIC RANK
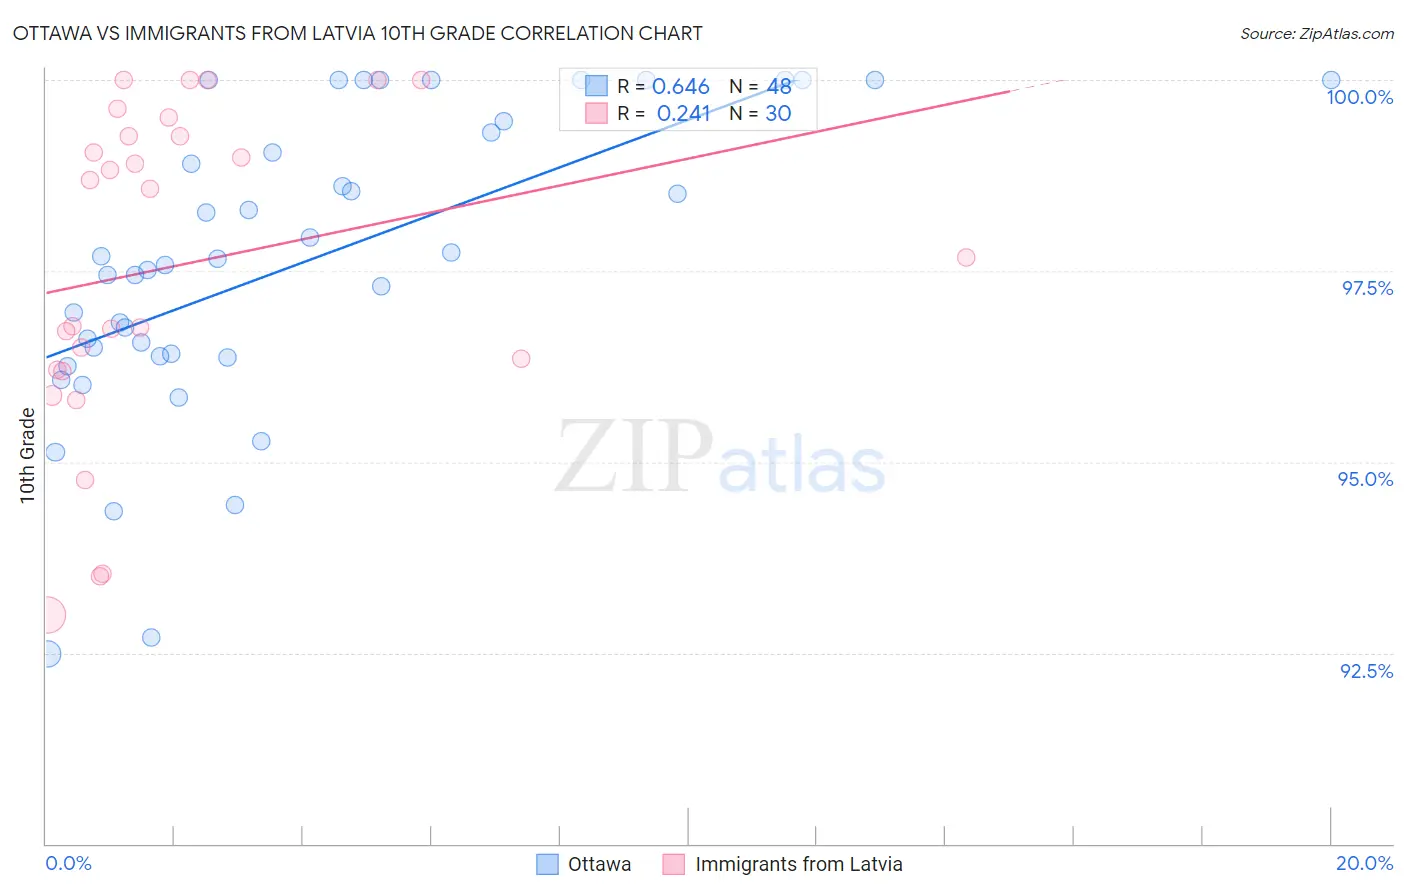
Ottawa vs Immigrants from Latvia 10th Grade Correlation Chart
The statistical analysis conducted on geographies consisting of 49,956,726 people shows a significant positive correlation between the proportion of Ottawa and percentage of population with at least 10th grade education in the United States with a correlation coefficient (R) of 0.646 and weighted average of 95.1%. Similarly, the statistical analysis conducted on geographies consisting of 113,734,781 people shows a weak positive correlation between the proportion of Immigrants from Latvia and percentage of population with at least 10th grade education in the United States with a correlation coefficient (R) of 0.241 and weighted average of 94.7%, a difference of 0.33%.
10th Grade Correlation Summary
| Measurement | Ottawa | Immigrants from Latvia |
| Minimum | 92.5% | 93.0% |
| Maximum | 100.0% | 100.0% |
| Range | 7.5% | 7.0% |
| Mean | 97.6% | 97.6% |
| Median | 97.6% | 98.1% |
| Interquartile 25% (IQ1) | 96.4% | 96.2% |
| Interquartile 75% (IQ3) | 99.4% | 99.3% |
| Interquartile Range (IQR) | 3.0% | 3.1% |
| Standard Deviation (Sample) | 2.0% | 2.1% |
| Standard Deviation (Population) | 1.9% | 2.1% |
Similar Demographics by 10th Grade
Demographics Similar to Ottawa by 10th Grade
In terms of 10th grade, the demographic groups most similar to Ottawa are Austrian (95.1%, a difference of 0.0%), Immigrants from Canada (95.1%, a difference of 0.010%), Immigrants from North America (95.0%, a difference of 0.010%), Immigrants from Lithuania (95.0%, a difference of 0.030%), and Immigrants from Austria (95.1%, a difference of 0.040%).
| Demographics | Rating | Rank | 10th Grade |
| Greeks | 99.9 /100 | #45 | Exceptional 95.2% |
| Czechoslovakians | 99.9 /100 | #46 | Exceptional 95.1% |
| Serbians | 99.9 /100 | #47 | Exceptional 95.1% |
| Australians | 99.9 /100 | #48 | Exceptional 95.1% |
| Immigrants | Austria | 99.9 /100 | #49 | Exceptional 95.1% |
| Immigrants | Canada | 99.8 /100 | #50 | Exceptional 95.1% |
| Austrians | 99.8 /100 | #51 | Exceptional 95.1% |
| Ottawa | 99.8 /100 | #52 | Exceptional 95.1% |
| Immigrants | North America | 99.8 /100 | #53 | Exceptional 95.0% |
| Immigrants | Lithuania | 99.8 /100 | #54 | Exceptional 95.0% |
| Immigrants | Ireland | 99.8 /100 | #55 | Exceptional 95.0% |
| New Zealanders | 99.8 /100 | #56 | Exceptional 95.0% |
| Ukrainians | 99.8 /100 | #57 | Exceptional 95.0% |
| Aleuts | 99.8 /100 | #58 | Exceptional 95.0% |
| Celtics | 99.8 /100 | #59 | Exceptional 95.0% |
Demographics Similar to Immigrants from Latvia by 10th Grade
In terms of 10th grade, the demographic groups most similar to Immigrants from Latvia are Immigrants from Denmark (94.7%, a difference of 0.0%), Immigrants from Czechoslovakia (94.7%, a difference of 0.010%), Swiss (94.7%, a difference of 0.030%), Immigrants from Western Europe (94.7%, a difference of 0.030%), and Filipino (94.8%, a difference of 0.040%).
| Demographics | Rating | Rank | 10th Grade |
| Canadians | 99.6 /100 | #74 | Exceptional 94.9% |
| Okinawans | 99.5 /100 | #75 | Exceptional 94.8% |
| Romanians | 99.5 /100 | #76 | Exceptional 94.8% |
| Immigrants | South Africa | 99.5 /100 | #77 | Exceptional 94.8% |
| Filipinos | 99.3 /100 | #78 | Exceptional 94.8% |
| Immigrants | Czechoslovakia | 99.2 /100 | #79 | Exceptional 94.7% |
| Immigrants | Denmark | 99.2 /100 | #80 | Exceptional 94.7% |
| Immigrants | Latvia | 99.2 /100 | #81 | Exceptional 94.7% |
| Swiss | 99.1 /100 | #82 | Exceptional 94.7% |
| Immigrants | Western Europe | 99.1 /100 | #83 | Exceptional 94.7% |
| Icelanders | 99.1 /100 | #84 | Exceptional 94.7% |
| Crow | 99.0 /100 | #85 | Exceptional 94.7% |
| Puget Sound Salish | 99.0 /100 | #86 | Exceptional 94.7% |
| Immigrants | Saudi Arabia | 99.0 /100 | #87 | Exceptional 94.7% |
| Immigrants | Japan | 99.0 /100 | #88 | Exceptional 94.7% |