Immigrants from Kuwait vs Immigrants from Latvia 10th Grade
COMPARE
Immigrants from Kuwait
Immigrants from Latvia
10th Grade
10th Grade Comparison
Immigrants from Kuwait
Immigrants from Latvia
94.4%
10TH GRADE
96.8/ 100
METRIC RATING
112th/ 347
METRIC RANK
94.7%
10TH GRADE
99.2/ 100
METRIC RATING
81st/ 347
METRIC RANK
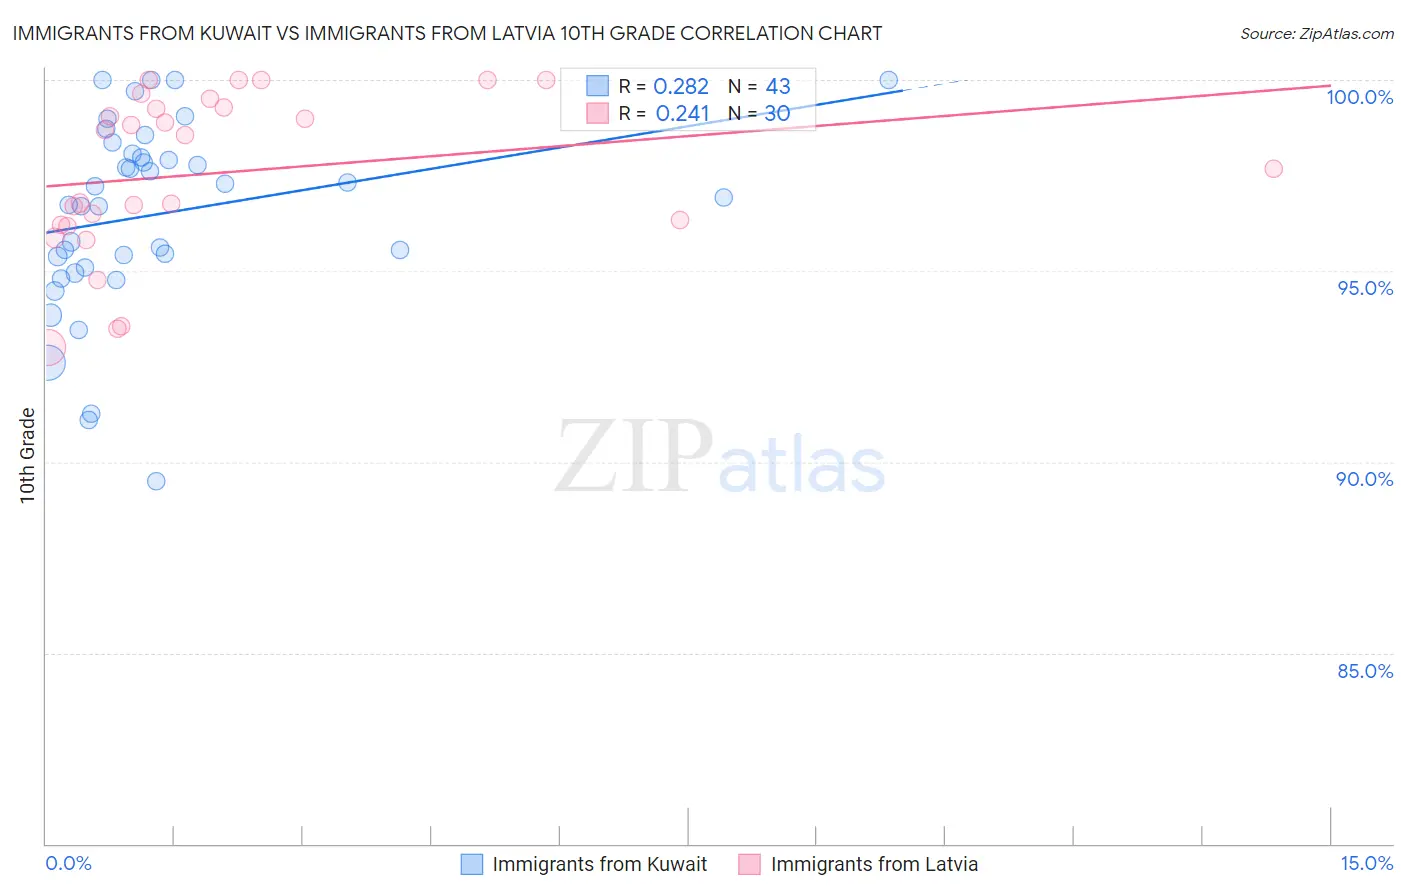
Immigrants from Kuwait vs Immigrants from Latvia 10th Grade Correlation Chart
The statistical analysis conducted on geographies consisting of 136,917,085 people shows a weak positive correlation between the proportion of Immigrants from Kuwait and percentage of population with at least 10th grade education in the United States with a correlation coefficient (R) of 0.282 and weighted average of 94.4%. Similarly, the statistical analysis conducted on geographies consisting of 113,734,781 people shows a weak positive correlation between the proportion of Immigrants from Latvia and percentage of population with at least 10th grade education in the United States with a correlation coefficient (R) of 0.241 and weighted average of 94.7%, a difference of 0.32%.
10th Grade Correlation Summary
| Measurement | Immigrants from Kuwait | Immigrants from Latvia |
| Minimum | 89.5% | 93.0% |
| Maximum | 100.0% | 100.0% |
| Range | 10.5% | 7.0% |
| Mean | 96.5% | 97.6% |
| Median | 96.9% | 98.1% |
| Interquartile 25% (IQ1) | 95.1% | 96.2% |
| Interquartile 75% (IQ3) | 98.1% | 99.3% |
| Interquartile Range (IQR) | 3.0% | 3.1% |
| Standard Deviation (Sample) | 2.5% | 2.1% |
| Standard Deviation (Population) | 2.5% | 2.1% |
Similar Demographics by 10th Grade
Demographics Similar to Immigrants from Kuwait by 10th Grade
In terms of 10th grade, the demographic groups most similar to Immigrants from Kuwait are Immigrants from Zimbabwe (94.4%, a difference of 0.010%), Palestinian (94.4%, a difference of 0.020%), Burmese (94.5%, a difference of 0.030%), German Russian (94.4%, a difference of 0.030%), and Delaware (94.4%, a difference of 0.030%).
| Demographics | Rating | Rank | 10th Grade |
| Immigrants | Turkey | 97.4 /100 | #105 | Exceptional 94.5% |
| Immigrants | Serbia | 97.4 /100 | #106 | Exceptional 94.5% |
| Immigrants | Croatia | 97.4 /100 | #107 | Exceptional 94.5% |
| Immigrants | North Macedonia | 97.2 /100 | #108 | Exceptional 94.5% |
| Immigrants | Norway | 97.2 /100 | #109 | Exceptional 94.5% |
| Burmese | 97.1 /100 | #110 | Exceptional 94.5% |
| Immigrants | Zimbabwe | 96.8 /100 | #111 | Exceptional 94.4% |
| Immigrants | Kuwait | 96.8 /100 | #112 | Exceptional 94.4% |
| Palestinians | 96.5 /100 | #113 | Exceptional 94.4% |
| German Russians | 96.3 /100 | #114 | Exceptional 94.4% |
| Delaware | 96.3 /100 | #115 | Exceptional 94.4% |
| Sioux | 96.2 /100 | #116 | Exceptional 94.4% |
| Immigrants | Hungary | 95.8 /100 | #117 | Exceptional 94.4% |
| Jordanians | 95.6 /100 | #118 | Exceptional 94.4% |
| Immigrants | Israel | 95.4 /100 | #119 | Exceptional 94.4% |
Demographics Similar to Immigrants from Latvia by 10th Grade
In terms of 10th grade, the demographic groups most similar to Immigrants from Latvia are Immigrants from Denmark (94.7%, a difference of 0.0%), Immigrants from Czechoslovakia (94.7%, a difference of 0.010%), Swiss (94.7%, a difference of 0.030%), Immigrants from Western Europe (94.7%, a difference of 0.030%), and Filipino (94.8%, a difference of 0.040%).
| Demographics | Rating | Rank | 10th Grade |
| Canadians | 99.6 /100 | #74 | Exceptional 94.9% |
| Okinawans | 99.5 /100 | #75 | Exceptional 94.8% |
| Romanians | 99.5 /100 | #76 | Exceptional 94.8% |
| Immigrants | South Africa | 99.5 /100 | #77 | Exceptional 94.8% |
| Filipinos | 99.3 /100 | #78 | Exceptional 94.8% |
| Immigrants | Czechoslovakia | 99.2 /100 | #79 | Exceptional 94.7% |
| Immigrants | Denmark | 99.2 /100 | #80 | Exceptional 94.7% |
| Immigrants | Latvia | 99.2 /100 | #81 | Exceptional 94.7% |
| Swiss | 99.1 /100 | #82 | Exceptional 94.7% |
| Immigrants | Western Europe | 99.1 /100 | #83 | Exceptional 94.7% |
| Icelanders | 99.1 /100 | #84 | Exceptional 94.7% |
| Crow | 99.0 /100 | #85 | Exceptional 94.7% |
| Puget Sound Salish | 99.0 /100 | #86 | Exceptional 94.7% |
| Immigrants | Saudi Arabia | 99.0 /100 | #87 | Exceptional 94.7% |
| Immigrants | Japan | 99.0 /100 | #88 | Exceptional 94.7% |