Mexican vs Immigrants from Latvia 10th Grade
COMPARE
Mexican
Immigrants from Latvia
10th Grade
10th Grade Comparison
Mexicans
Immigrants from Latvia
87.8%
10TH GRADE
0.0/ 100
METRIC RATING
340th/ 347
METRIC RANK
94.7%
10TH GRADE
99.2/ 100
METRIC RATING
81st/ 347
METRIC RANK
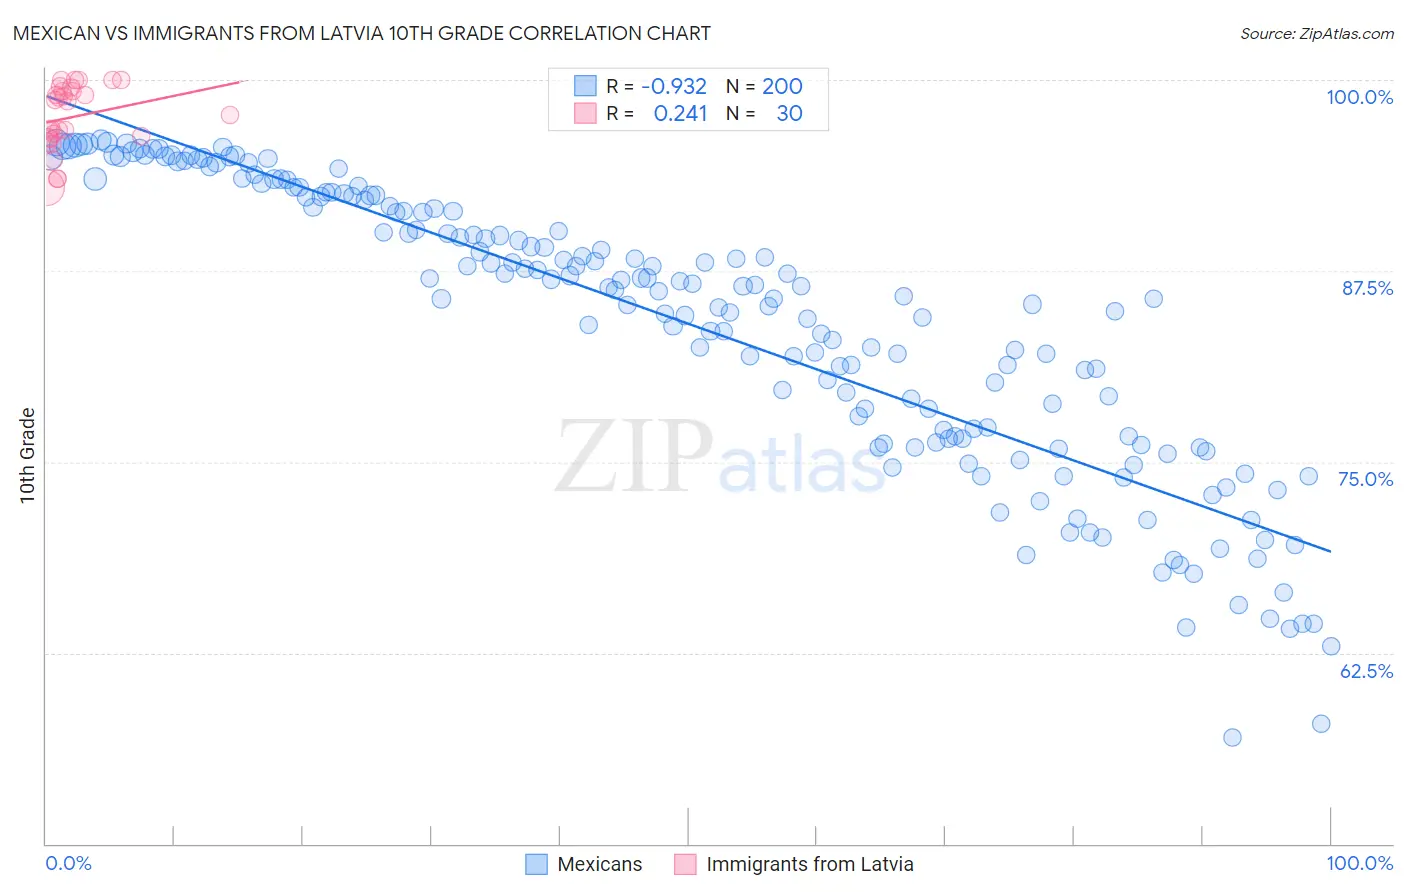
Mexican vs Immigrants from Latvia 10th Grade Correlation Chart
The statistical analysis conducted on geographies consisting of 565,338,990 people shows a near-perfect negative correlation between the proportion of Mexicans and percentage of population with at least 10th grade education in the United States with a correlation coefficient (R) of -0.932 and weighted average of 87.8%. Similarly, the statistical analysis conducted on geographies consisting of 113,734,781 people shows a weak positive correlation between the proportion of Immigrants from Latvia and percentage of population with at least 10th grade education in the United States with a correlation coefficient (R) of 0.241 and weighted average of 94.7%, a difference of 8.0%.
10th Grade Correlation Summary
| Measurement | Mexican | Immigrants from Latvia |
| Minimum | 57.0% | 93.0% |
| Maximum | 96.1% | 100.0% |
| Range | 39.1% | 7.0% |
| Mean | 84.0% | 97.6% |
| Median | 86.3% | 98.1% |
| Interquartile 25% (IQ1) | 76.6% | 96.2% |
| Interquartile 75% (IQ3) | 92.3% | 99.3% |
| Interquartile Range (IQR) | 15.7% | 3.1% |
| Standard Deviation (Sample) | 9.3% | 2.1% |
| Standard Deviation (Population) | 9.2% | 2.1% |
Similar Demographics by 10th Grade
Demographics Similar to Mexicans by 10th Grade
In terms of 10th grade, the demographic groups most similar to Mexicans are Guatemalan (87.9%, a difference of 0.16%), Salvadoran (87.5%, a difference of 0.29%), Immigrants from Guatemala (87.4%, a difference of 0.44%), Immigrants from Latin America (88.3%, a difference of 0.65%), and Central American (88.4%, a difference of 0.71%).
| Demographics | Rating | Rank | 10th Grade |
| Hondurans | 0.0 /100 | #333 | Tragic 89.0% |
| Hispanics or Latinos | 0.0 /100 | #334 | Tragic 88.9% |
| Immigrants | Dominican Republic | 0.0 /100 | #335 | Tragic 88.7% |
| Immigrants | Honduras | 0.0 /100 | #336 | Tragic 88.5% |
| Central Americans | 0.0 /100 | #337 | Tragic 88.4% |
| Immigrants | Latin America | 0.0 /100 | #338 | Tragic 88.3% |
| Guatemalans | 0.0 /100 | #339 | Tragic 87.9% |
| Mexicans | 0.0 /100 | #340 | Tragic 87.8% |
| Salvadorans | 0.0 /100 | #341 | Tragic 87.5% |
| Immigrants | Guatemala | 0.0 /100 | #342 | Tragic 87.4% |
| Yakama | 0.0 /100 | #343 | Tragic 86.9% |
| Immigrants | El Salvador | 0.0 /100 | #344 | Tragic 86.8% |
| Immigrants | Central America | 0.0 /100 | #345 | Tragic 86.6% |
| Spanish American Indians | 0.0 /100 | #346 | Tragic 86.2% |
| Immigrants | Mexico | 0.0 /100 | #347 | Tragic 86.2% |
Demographics Similar to Immigrants from Latvia by 10th Grade
In terms of 10th grade, the demographic groups most similar to Immigrants from Latvia are Immigrants from Denmark (94.7%, a difference of 0.0%), Immigrants from Czechoslovakia (94.7%, a difference of 0.010%), Swiss (94.7%, a difference of 0.030%), Immigrants from Western Europe (94.7%, a difference of 0.030%), and Filipino (94.8%, a difference of 0.040%).
| Demographics | Rating | Rank | 10th Grade |
| Canadians | 99.6 /100 | #74 | Exceptional 94.9% |
| Okinawans | 99.5 /100 | #75 | Exceptional 94.8% |
| Romanians | 99.5 /100 | #76 | Exceptional 94.8% |
| Immigrants | South Africa | 99.5 /100 | #77 | Exceptional 94.8% |
| Filipinos | 99.3 /100 | #78 | Exceptional 94.8% |
| Immigrants | Czechoslovakia | 99.2 /100 | #79 | Exceptional 94.7% |
| Immigrants | Denmark | 99.2 /100 | #80 | Exceptional 94.7% |
| Immigrants | Latvia | 99.2 /100 | #81 | Exceptional 94.7% |
| Swiss | 99.1 /100 | #82 | Exceptional 94.7% |
| Immigrants | Western Europe | 99.1 /100 | #83 | Exceptional 94.7% |
| Icelanders | 99.1 /100 | #84 | Exceptional 94.7% |
| Crow | 99.0 /100 | #85 | Exceptional 94.7% |
| Puget Sound Salish | 99.0 /100 | #86 | Exceptional 94.7% |
| Immigrants | Saudi Arabia | 99.0 /100 | #87 | Exceptional 94.7% |
| Immigrants | Japan | 99.0 /100 | #88 | Exceptional 94.7% |