Immigrants from Cambodia vs Basque No Schooling Completed
COMPARE
Immigrants from Cambodia
Basque
No Schooling Completed
No Schooling Completed Comparison
Immigrants from Cambodia
Basques
3.5%
NO SCHOOLING COMPLETED
0.0/ 100
METRIC RATING
335th/ 347
METRIC RANK
1.8%
NO SCHOOLING COMPLETED
97.9/ 100
METRIC RATING
103rd/ 347
METRIC RANK
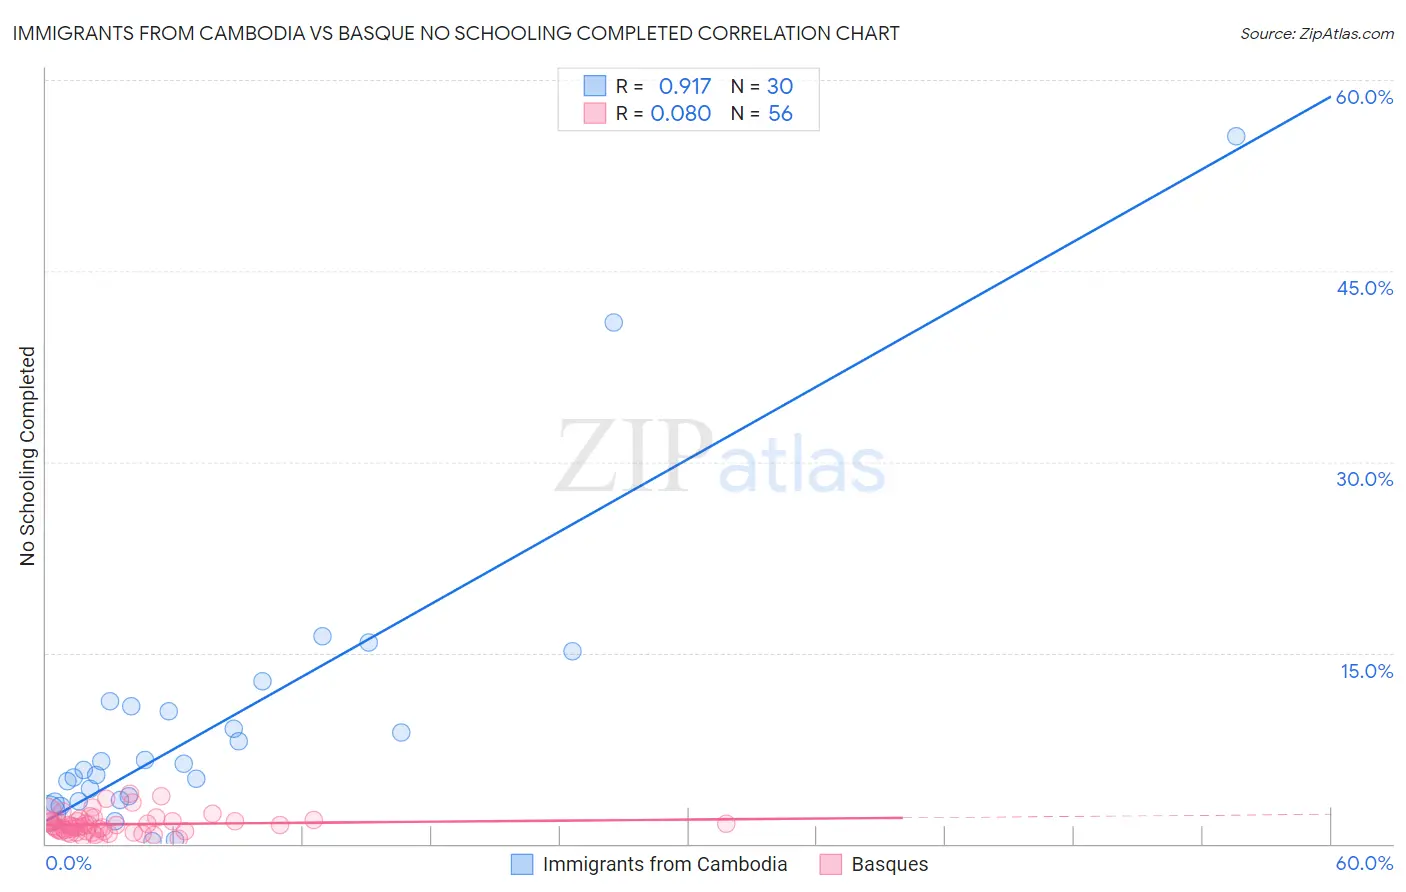
Immigrants from Cambodia vs Basque No Schooling Completed Correlation Chart
The statistical analysis conducted on geographies consisting of 204,723,315 people shows a near-perfect positive correlation between the proportion of Immigrants from Cambodia and percentage of population with no schooling in the United States with a correlation coefficient (R) of 0.917 and weighted average of 3.5%. Similarly, the statistical analysis conducted on geographies consisting of 164,919,642 people shows a slight positive correlation between the proportion of Basques and percentage of population with no schooling in the United States with a correlation coefficient (R) of 0.080 and weighted average of 1.8%, a difference of 91.8%.
No Schooling Completed Correlation Summary
| Measurement | Immigrants from Cambodia | Basque |
| Minimum | 0.15% | 0.17% |
| Maximum | 55.6% | 4.0% |
| Range | 55.4% | 3.8% |
| Mean | 9.5% | 1.5% |
| Median | 6.0% | 1.4% |
| Interquartile 25% (IQ1) | 3.4% | 0.96% |
| Interquartile 75% (IQ3) | 10.8% | 1.8% |
| Interquartile Range (IQR) | 7.4% | 0.85% |
| Standard Deviation (Sample) | 11.5% | 0.80% |
| Standard Deviation (Population) | 11.4% | 0.79% |
Similar Demographics by No Schooling Completed
Demographics Similar to Immigrants from Cambodia by No Schooling Completed
In terms of no schooling completed, the demographic groups most similar to Immigrants from Cambodia are Immigrants from Fiji (3.5%, a difference of 0.37%), Guatemalan (3.5%, a difference of 1.0%), Immigrants from Cabo Verde (3.5%, a difference of 1.1%), Bangladeshi (3.5%, a difference of 1.3%), and Yakama (3.6%, a difference of 1.6%).
| Demographics | Rating | Rank | No Schooling Completed |
| Mexicans | 0.0 /100 | #328 | Tragic 3.3% |
| Immigrants | Vietnam | 0.0 /100 | #329 | Tragic 3.3% |
| Immigrants | Armenia | 0.0 /100 | #330 | Tragic 3.3% |
| Japanese | 0.0 /100 | #331 | Tragic 3.3% |
| Central Americans | 0.0 /100 | #332 | Tragic 3.4% |
| Immigrants | Dominican Republic | 0.0 /100 | #333 | Tragic 3.4% |
| Guatemalans | 0.0 /100 | #334 | Tragic 3.5% |
| Immigrants | Cambodia | 0.0 /100 | #335 | Tragic 3.5% |
| Immigrants | Fiji | 0.0 /100 | #336 | Tragic 3.5% |
| Immigrants | Cabo Verde | 0.0 /100 | #337 | Tragic 3.5% |
| Bangladeshis | 0.0 /100 | #338 | Tragic 3.5% |
| Yakama | 0.0 /100 | #339 | Tragic 3.6% |
| Immigrants | Guatemala | 0.0 /100 | #340 | Tragic 3.6% |
| Immigrants | Central America | 0.0 /100 | #341 | Tragic 3.6% |
| Immigrants | Mexico | 0.0 /100 | #342 | Tragic 3.6% |
Demographics Similar to Basques by No Schooling Completed
In terms of no schooling completed, the demographic groups most similar to Basques are Immigrants from Switzerland (1.8%, a difference of 0.050%), Immigrants from Czechoslovakia (1.8%, a difference of 0.060%), Immigrants from Singapore (1.8%, a difference of 0.35%), Choctaw (1.8%, a difference of 0.55%), and Thai (1.8%, a difference of 0.57%).
| Demographics | Rating | Rank | No Schooling Completed |
| Bhutanese | 98.4 /100 | #96 | Exceptional 1.8% |
| Immigrants | Ireland | 98.4 /100 | #97 | Exceptional 1.8% |
| Iranians | 98.2 /100 | #98 | Exceptional 1.8% |
| Choctaw | 98.1 /100 | #99 | Exceptional 1.8% |
| Immigrants | Singapore | 98.0 /100 | #100 | Exceptional 1.8% |
| Immigrants | Czechoslovakia | 97.9 /100 | #101 | Exceptional 1.8% |
| Immigrants | Switzerland | 97.9 /100 | #102 | Exceptional 1.8% |
| Basques | 97.9 /100 | #103 | Exceptional 1.8% |
| Thais | 97.5 /100 | #104 | Exceptional 1.8% |
| German Russians | 97.5 /100 | #105 | Exceptional 1.8% |
| Immigrants | France | 97.3 /100 | #106 | Exceptional 1.8% |
| Yugoslavians | 97.2 /100 | #107 | Exceptional 1.8% |
| Okinawans | 97.1 /100 | #108 | Exceptional 1.8% |
| Immigrants | Saudi Arabia | 96.8 /100 | #109 | Exceptional 1.9% |
| Immigrants | Latvia | 96.7 /100 | #110 | Exceptional 1.9% |