Scandinavian vs Immigrants from England High School Diploma
COMPARE
Scandinavian
Immigrants from England
High School Diploma
High School Diploma Comparison
Scandinavians
Immigrants from England
91.5%
HIGH SCHOOL DIPLOMA
99.9/ 100
METRIC RATING
23rd/ 347
METRIC RANK
90.8%
HIGH SCHOOL DIPLOMA
99.3/ 100
METRIC RATING
80th/ 347
METRIC RANK
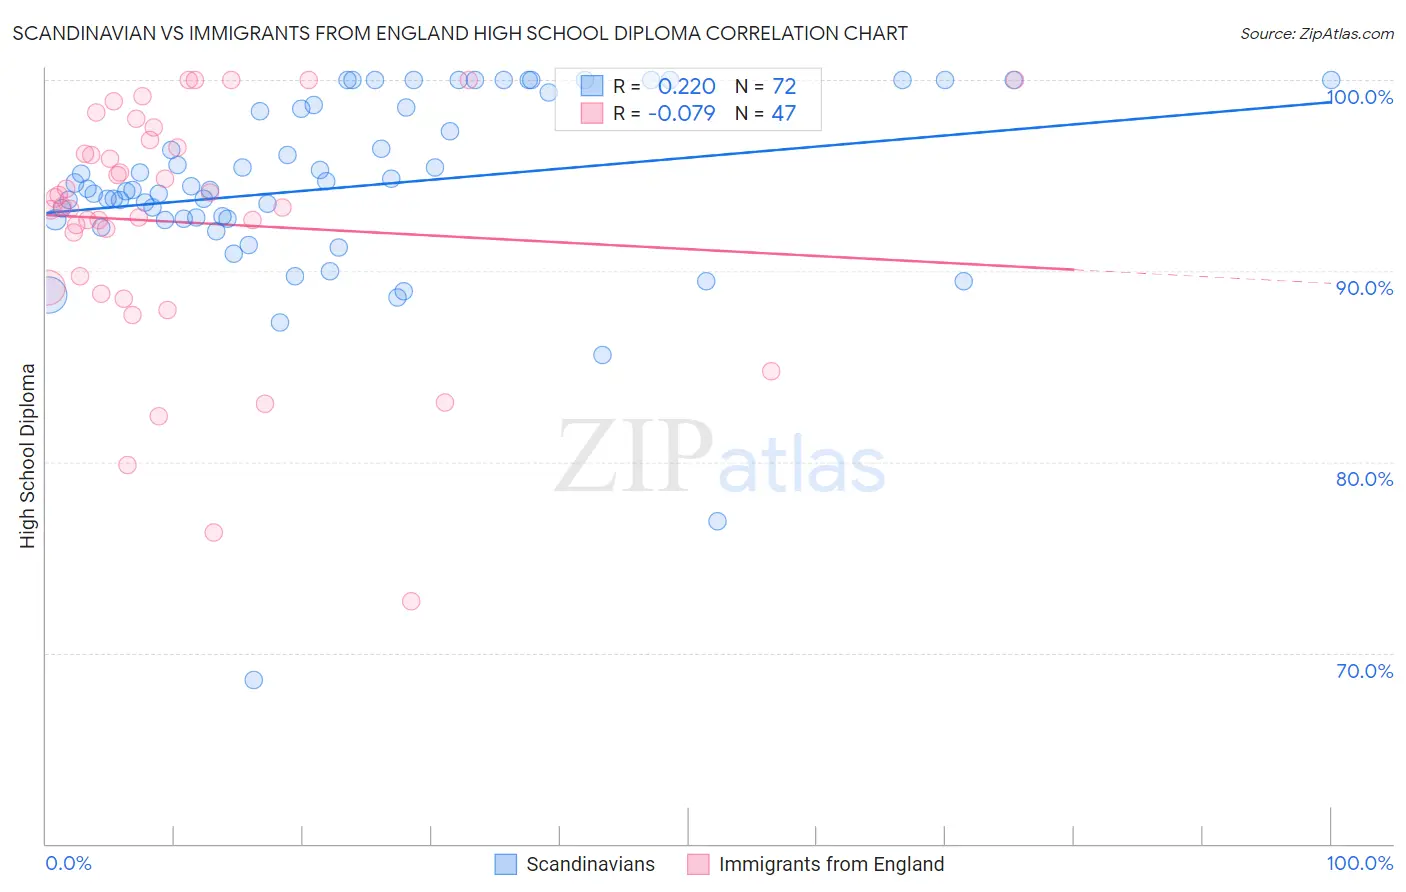
Scandinavian vs Immigrants from England High School Diploma Correlation Chart
The statistical analysis conducted on geographies consisting of 472,659,475 people shows a weak positive correlation between the proportion of Scandinavians and percentage of population with at least high school diploma education in the United States with a correlation coefficient (R) of 0.220 and weighted average of 91.5%. Similarly, the statistical analysis conducted on geographies consisting of 391,897,700 people shows a slight negative correlation between the proportion of Immigrants from England and percentage of population with at least high school diploma education in the United States with a correlation coefficient (R) of -0.079 and weighted average of 90.8%, a difference of 0.81%.
High School Diploma Correlation Summary
| Measurement | Scandinavian | Immigrants from England |
| Minimum | 68.6% | 72.7% |
| Maximum | 100.0% | 100.0% |
| Range | 31.4% | 27.3% |
| Mean | 94.4% | 92.5% |
| Median | 94.3% | 93.4% |
| Interquartile 25% (IQ1) | 92.7% | 89.1% |
| Interquartile 75% (IQ3) | 98.6% | 96.9% |
| Interquartile Range (IQR) | 5.9% | 7.8% |
| Standard Deviation (Sample) | 5.3% | 6.4% |
| Standard Deviation (Population) | 5.2% | 6.3% |
Similar Demographics by High School Diploma
Demographics Similar to Scandinavians by High School Diploma
In terms of high school diploma, the demographic groups most similar to Scandinavians are Italian (91.5%, a difference of 0.0%), Thai (91.5%, a difference of 0.0%), Estonian (91.6%, a difference of 0.030%), Filipino (91.6%, a difference of 0.040%), and Czech (91.6%, a difference of 0.050%).
| Demographics | Rating | Rank | High School Diploma |
| Finns | 100.0 /100 | #16 | Exceptional 91.7% |
| Immigrants | Singapore | 99.9 /100 | #17 | Exceptional 91.7% |
| Germans | 99.9 /100 | #18 | Exceptional 91.7% |
| Maltese | 99.9 /100 | #19 | Exceptional 91.6% |
| Czechs | 99.9 /100 | #20 | Exceptional 91.6% |
| Filipinos | 99.9 /100 | #21 | Exceptional 91.6% |
| Estonians | 99.9 /100 | #22 | Exceptional 91.6% |
| Scandinavians | 99.9 /100 | #23 | Exceptional 91.5% |
| Italians | 99.9 /100 | #24 | Exceptional 91.5% |
| Thais | 99.9 /100 | #25 | Exceptional 91.5% |
| Russians | 99.9 /100 | #26 | Exceptional 91.5% |
| Cypriots | 99.9 /100 | #27 | Exceptional 91.5% |
| Tlingit-Haida | 99.9 /100 | #28 | Exceptional 91.4% |
| Europeans | 99.9 /100 | #29 | Exceptional 91.4% |
| Iranians | 99.9 /100 | #30 | Exceptional 91.4% |
Demographics Similar to Immigrants from England by High School Diploma
In terms of high school diploma, the demographic groups most similar to Immigrants from England are Immigrants from Switzerland (90.8%, a difference of 0.0%), Immigrants from Denmark (90.8%, a difference of 0.010%), Native Hawaiian (90.8%, a difference of 0.020%), Burmese (90.8%, a difference of 0.020%), and Hungarian (90.8%, a difference of 0.030%).
| Demographics | Rating | Rank | High School Diploma |
| Immigrants | South Central Asia | 99.4 /100 | #73 | Exceptional 90.9% |
| Immigrants | Czechoslovakia | 99.4 /100 | #74 | Exceptional 90.9% |
| Cambodians | 99.4 /100 | #75 | Exceptional 90.8% |
| Hungarians | 99.3 /100 | #76 | Exceptional 90.8% |
| Native Hawaiians | 99.3 /100 | #77 | Exceptional 90.8% |
| Burmese | 99.3 /100 | #78 | Exceptional 90.8% |
| Immigrants | Denmark | 99.3 /100 | #79 | Exceptional 90.8% |
| Immigrants | England | 99.3 /100 | #80 | Exceptional 90.8% |
| Immigrants | Switzerland | 99.3 /100 | #81 | Exceptional 90.8% |
| Scotch-Irish | 99.2 /100 | #82 | Exceptional 90.8% |
| Immigrants | Moldova | 99.2 /100 | #83 | Exceptional 90.7% |
| Immigrants | Saudi Arabia | 99.1 /100 | #84 | Exceptional 90.7% |
| Romanians | 98.9 /100 | #85 | Exceptional 90.7% |
| Immigrants | Bulgaria | 98.9 /100 | #86 | Exceptional 90.6% |
| Immigrants | Turkey | 98.9 /100 | #87 | Exceptional 90.6% |