Scandinavian vs Cheyenne No Schooling Completed
COMPARE
Scandinavian
Cheyenne
No Schooling Completed
No Schooling Completed Comparison
Scandinavians
Cheyenne
1.5%
NO SCHOOLING COMPLETED
100.0/ 100
METRIC RATING
27th/ 347
METRIC RANK
2.1%
NO SCHOOLING COMPLETED
58.6/ 100
METRIC RATING
168th/ 347
METRIC RANK
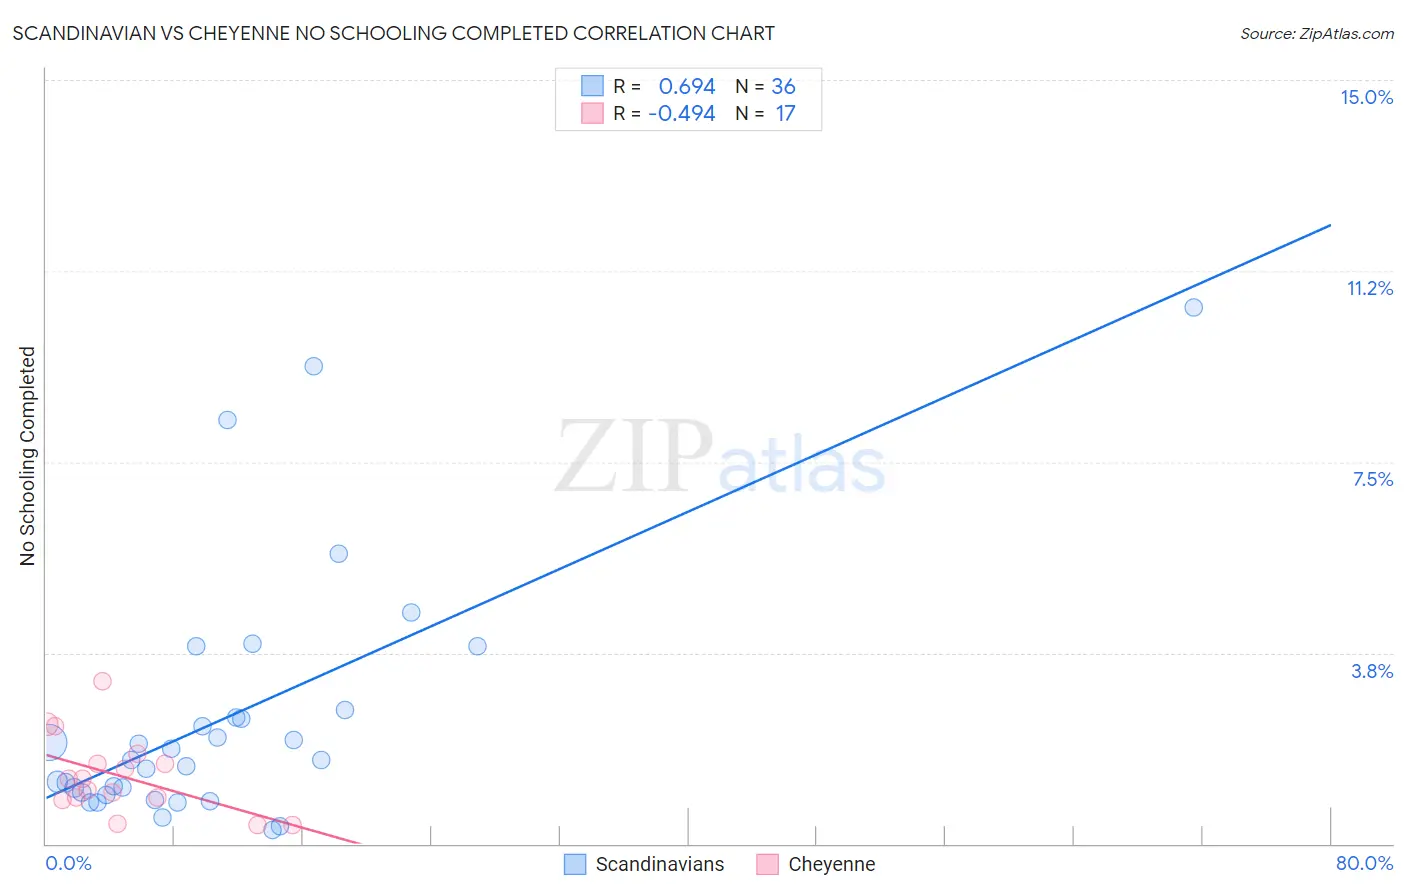
Scandinavian vs Cheyenne No Schooling Completed Correlation Chart
The statistical analysis conducted on geographies consisting of 462,495,529 people shows a significant positive correlation between the proportion of Scandinavians and percentage of population with no schooling in the United States with a correlation coefficient (R) of 0.694 and weighted average of 1.5%. Similarly, the statistical analysis conducted on geographies consisting of 80,362,041 people shows a moderate negative correlation between the proportion of Cheyenne and percentage of population with no schooling in the United States with a correlation coefficient (R) of -0.494 and weighted average of 2.1%, a difference of 37.8%.
No Schooling Completed Correlation Summary
| Measurement | Scandinavian | Cheyenne |
| Minimum | 0.27% | 0.36% |
| Maximum | 10.5% | 3.2% |
| Range | 10.3% | 2.8% |
| Mean | 2.5% | 1.3% |
| Median | 1.6% | 1.3% |
| Interquartile 25% (IQ1) | 0.98% | 0.88% |
| Interquartile 75% (IQ3) | 2.6% | 1.7% |
| Interquartile Range (IQR) | 1.6% | 0.78% |
| Standard Deviation (Sample) | 2.5% | 0.76% |
| Standard Deviation (Population) | 2.4% | 0.74% |
Similar Demographics by No Schooling Completed
Demographics Similar to Scandinavians by No Schooling Completed
In terms of no schooling completed, the demographic groups most similar to Scandinavians are French Canadian (1.5%, a difference of 0.010%), Czech (1.5%, a difference of 0.53%), Lumbee (1.5%, a difference of 0.92%), French (1.5%, a difference of 1.1%), and Pennsylvania German (1.5%, a difference of 1.1%).
| Demographics | Rating | Rank | No Schooling Completed |
| Welsh | 100.0 /100 | #20 | Exceptional 1.5% |
| Chinese | 100.0 /100 | #21 | Exceptional 1.5% |
| Alaska Natives | 100.0 /100 | #22 | Exceptional 1.5% |
| Europeans | 100.0 /100 | #23 | Exceptional 1.5% |
| Pennsylvania Germans | 100.0 /100 | #24 | Exceptional 1.5% |
| French | 100.0 /100 | #25 | Exceptional 1.5% |
| Czechs | 100.0 /100 | #26 | Exceptional 1.5% |
| Scandinavians | 100.0 /100 | #27 | Exceptional 1.5% |
| French Canadians | 100.0 /100 | #28 | Exceptional 1.5% |
| Lumbee | 100.0 /100 | #29 | Exceptional 1.5% |
| British | 100.0 /100 | #30 | Exceptional 1.5% |
| Inupiat | 100.0 /100 | #31 | Exceptional 1.5% |
| Swiss | 100.0 /100 | #32 | Exceptional 1.5% |
| Italians | 100.0 /100 | #33 | Exceptional 1.5% |
| Latvians | 100.0 /100 | #34 | Exceptional 1.5% |
Demographics Similar to Cheyenne by No Schooling Completed
In terms of no schooling completed, the demographic groups most similar to Cheyenne are Egyptian (2.1%, a difference of 0.080%), Dutch West Indian (2.1%, a difference of 0.18%), Brazilian (2.1%, a difference of 0.23%), Apache (2.1%, a difference of 0.27%), and Comanche (2.1%, a difference of 0.29%).
| Demographics | Rating | Rank | No Schooling Completed |
| Ugandans | 64.6 /100 | #161 | Good 2.0% |
| Immigrants | Brazil | 63.8 /100 | #162 | Good 2.1% |
| Albanians | 62.2 /100 | #163 | Good 2.1% |
| Comanche | 60.7 /100 | #164 | Good 2.1% |
| Brazilians | 60.2 /100 | #165 | Good 2.1% |
| Dutch West Indians | 59.9 /100 | #166 | Average 2.1% |
| Egyptians | 59.2 /100 | #167 | Average 2.1% |
| Cheyenne | 58.6 /100 | #168 | Average 2.1% |
| Apache | 56.7 /100 | #169 | Average 2.1% |
| Argentineans | 56.0 /100 | #170 | Average 2.1% |
| Immigrants | Poland | 55.2 /100 | #171 | Average 2.1% |
| Immigrants | Argentina | 52.7 /100 | #172 | Average 2.1% |
| Immigrants | Belarus | 51.8 /100 | #173 | Average 2.1% |
| Immigrants | Micronesia | 50.0 /100 | #174 | Average 2.1% |
| Arabs | 46.4 /100 | #175 | Average 2.1% |