Dutch vs Cheyenne No Schooling Completed
COMPARE
Dutch
Cheyenne
No Schooling Completed
No Schooling Completed Comparison
Dutch
Cheyenne
1.4%
NO SCHOOLING COMPLETED
100.0/ 100
METRIC RATING
10th/ 347
METRIC RANK
2.1%
NO SCHOOLING COMPLETED
58.6/ 100
METRIC RATING
168th/ 347
METRIC RANK
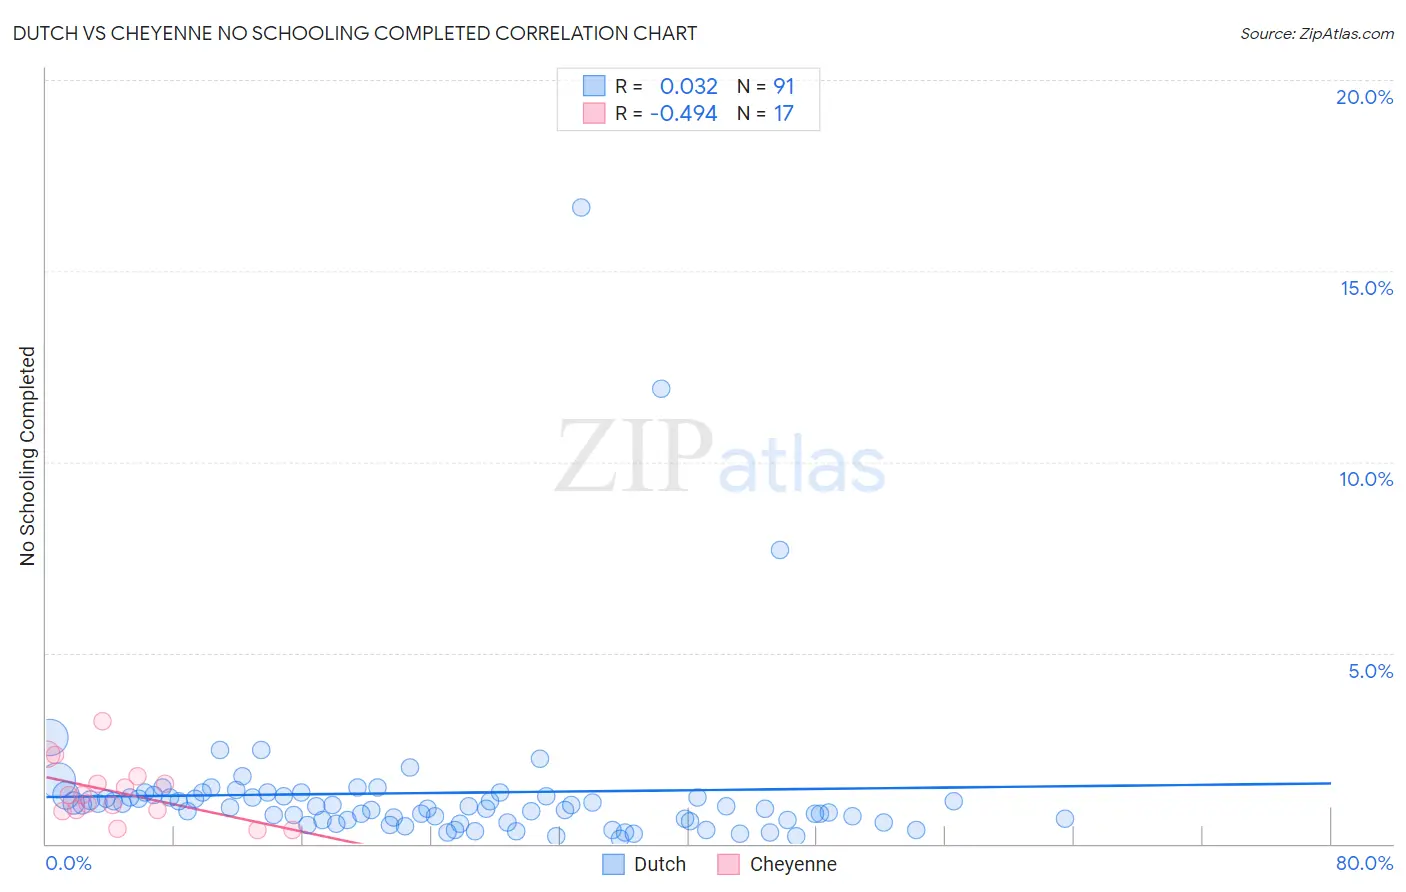
Dutch vs Cheyenne No Schooling Completed Correlation Chart
The statistical analysis conducted on geographies consisting of 537,646,612 people shows no correlation between the proportion of Dutch and percentage of population with no schooling in the United States with a correlation coefficient (R) of 0.032 and weighted average of 1.4%. Similarly, the statistical analysis conducted on geographies consisting of 80,362,041 people shows a moderate negative correlation between the proportion of Cheyenne and percentage of population with no schooling in the United States with a correlation coefficient (R) of -0.494 and weighted average of 2.1%, a difference of 45.0%.
No Schooling Completed Correlation Summary
| Measurement | Dutch | Cheyenne |
| Minimum | 0.12% | 0.36% |
| Maximum | 16.7% | 3.2% |
| Range | 16.5% | 2.8% |
| Mean | 1.3% | 1.3% |
| Median | 0.97% | 1.3% |
| Interquartile 25% (IQ1) | 0.62% | 0.88% |
| Interquartile 75% (IQ3) | 1.3% | 1.7% |
| Interquartile Range (IQR) | 0.63% | 0.78% |
| Standard Deviation (Sample) | 2.2% | 0.76% |
| Standard Deviation (Population) | 2.2% | 0.74% |
Similar Demographics by No Schooling Completed
Demographics Similar to Dutch by No Schooling Completed
In terms of no schooling completed, the demographic groups most similar to Dutch are Scottish (1.4%, a difference of 0.80%), Lithuanian (1.4%, a difference of 0.84%), Irish (1.4%, a difference of 0.86%), Polish (1.4%, a difference of 0.89%), and Swedish (1.4%, a difference of 1.3%).
| Demographics | Rating | Rank | No Schooling Completed |
| Norwegians | 100.0 /100 | #3 | Exceptional 1.3% |
| Germans | 100.0 /100 | #4 | Exceptional 1.4% |
| Slovenes | 100.0 /100 | #5 | Exceptional 1.4% |
| Carpatho Rusyns | 100.0 /100 | #6 | Exceptional 1.4% |
| English | 100.0 /100 | #7 | Exceptional 1.4% |
| Swedes | 100.0 /100 | #8 | Exceptional 1.4% |
| Scottish | 100.0 /100 | #9 | Exceptional 1.4% |
| Dutch | 100.0 /100 | #10 | Exceptional 1.4% |
| Lithuanians | 100.0 /100 | #11 | Exceptional 1.4% |
| Irish | 100.0 /100 | #12 | Exceptional 1.4% |
| Poles | 100.0 /100 | #13 | Exceptional 1.4% |
| Scotch-Irish | 100.0 /100 | #14 | Exceptional 1.5% |
| Tlingit-Haida | 100.0 /100 | #15 | Exceptional 1.5% |
| Finns | 100.0 /100 | #16 | Exceptional 1.5% |
| Croatians | 100.0 /100 | #17 | Exceptional 1.5% |
Demographics Similar to Cheyenne by No Schooling Completed
In terms of no schooling completed, the demographic groups most similar to Cheyenne are Egyptian (2.1%, a difference of 0.080%), Dutch West Indian (2.1%, a difference of 0.18%), Brazilian (2.1%, a difference of 0.23%), Apache (2.1%, a difference of 0.27%), and Comanche (2.1%, a difference of 0.29%).
| Demographics | Rating | Rank | No Schooling Completed |
| Ugandans | 64.6 /100 | #161 | Good 2.0% |
| Immigrants | Brazil | 63.8 /100 | #162 | Good 2.1% |
| Albanians | 62.2 /100 | #163 | Good 2.1% |
| Comanche | 60.7 /100 | #164 | Good 2.1% |
| Brazilians | 60.2 /100 | #165 | Good 2.1% |
| Dutch West Indians | 59.9 /100 | #166 | Average 2.1% |
| Egyptians | 59.2 /100 | #167 | Average 2.1% |
| Cheyenne | 58.6 /100 | #168 | Average 2.1% |
| Apache | 56.7 /100 | #169 | Average 2.1% |
| Argentineans | 56.0 /100 | #170 | Average 2.1% |
| Immigrants | Poland | 55.2 /100 | #171 | Average 2.1% |
| Immigrants | Argentina | 52.7 /100 | #172 | Average 2.1% |
| Immigrants | Belarus | 51.8 /100 | #173 | Average 2.1% |
| Immigrants | Micronesia | 50.0 /100 | #174 | Average 2.1% |
| Arabs | 46.4 /100 | #175 | Average 2.1% |