Scandinavian vs Assyrian/Chaldean/Syriac No Schooling Completed
COMPARE
Scandinavian
Assyrian/Chaldean/Syriac
No Schooling Completed
No Schooling Completed Comparison
Scandinavians
Assyrians/Chaldeans/Syriacs
1.5%
NO SCHOOLING COMPLETED
100.0/ 100
METRIC RATING
27th/ 347
METRIC RANK
2.5%
NO SCHOOLING COMPLETED
0.6/ 100
METRIC RATING
258th/ 347
METRIC RANK
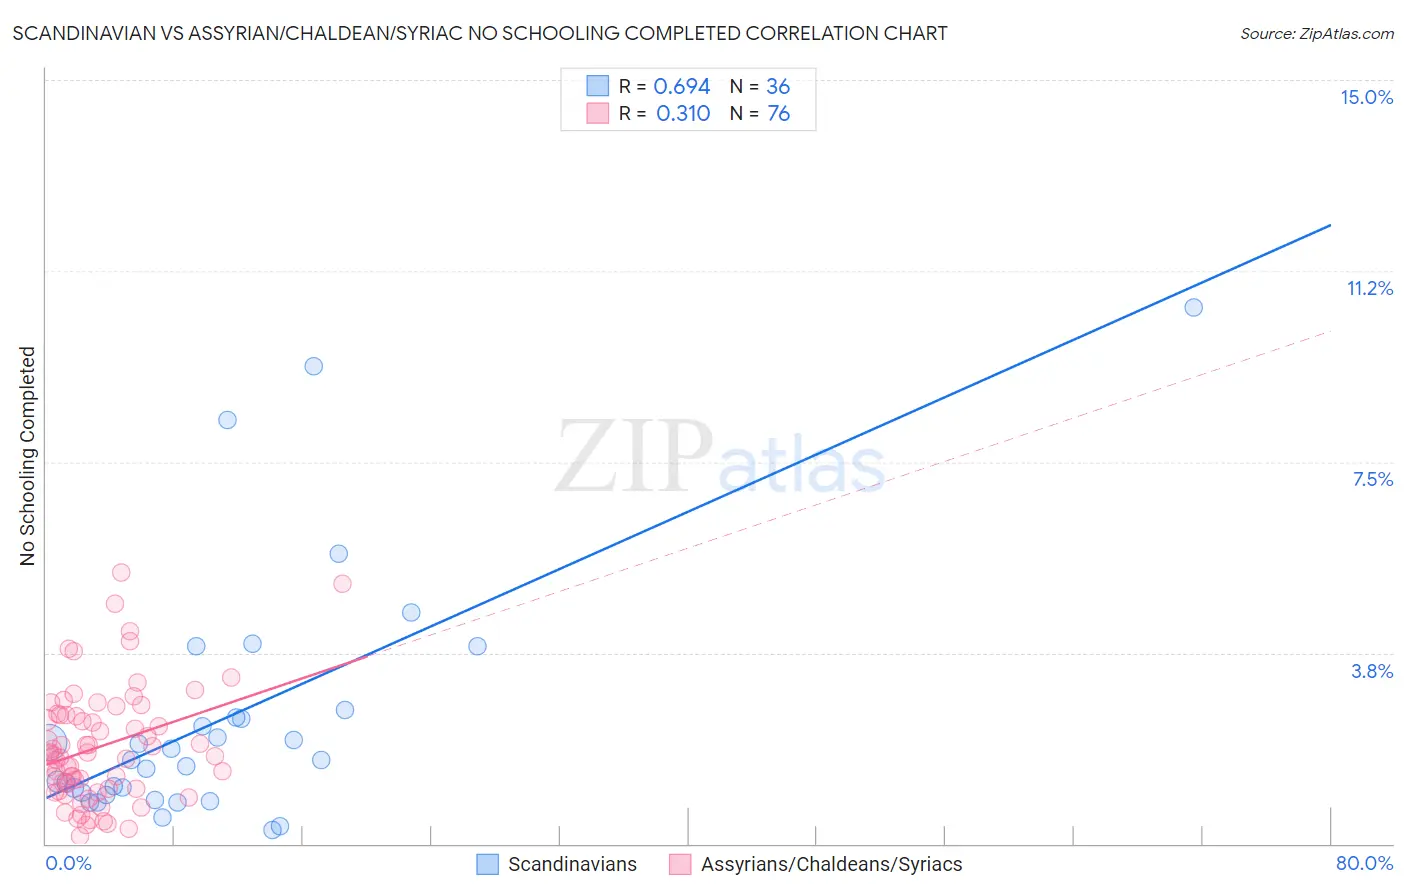
Scandinavian vs Assyrian/Chaldean/Syriac No Schooling Completed Correlation Chart
The statistical analysis conducted on geographies consisting of 462,495,529 people shows a significant positive correlation between the proportion of Scandinavians and percentage of population with no schooling in the United States with a correlation coefficient (R) of 0.694 and weighted average of 1.5%. Similarly, the statistical analysis conducted on geographies consisting of 110,066,308 people shows a mild positive correlation between the proportion of Assyrians/Chaldeans/Syriacs and percentage of population with no schooling in the United States with a correlation coefficient (R) of 0.310 and weighted average of 2.5%, a difference of 63.5%.
No Schooling Completed Correlation Summary
| Measurement | Scandinavian | Assyrian/Chaldean/Syriac |
| Minimum | 0.27% | 0.15% |
| Maximum | 10.5% | 5.3% |
| Range | 10.3% | 5.2% |
| Mean | 2.5% | 1.9% |
| Median | 1.6% | 1.8% |
| Interquartile 25% (IQ1) | 0.98% | 1.1% |
| Interquartile 75% (IQ3) | 2.6% | 2.5% |
| Interquartile Range (IQR) | 1.6% | 1.4% |
| Standard Deviation (Sample) | 2.5% | 1.1% |
| Standard Deviation (Population) | 2.4% | 1.1% |
Similar Demographics by No Schooling Completed
Demographics Similar to Scandinavians by No Schooling Completed
In terms of no schooling completed, the demographic groups most similar to Scandinavians are French Canadian (1.5%, a difference of 0.010%), Czech (1.5%, a difference of 0.53%), Lumbee (1.5%, a difference of 0.92%), French (1.5%, a difference of 1.1%), and Pennsylvania German (1.5%, a difference of 1.1%).
| Demographics | Rating | Rank | No Schooling Completed |
| Welsh | 100.0 /100 | #20 | Exceptional 1.5% |
| Chinese | 100.0 /100 | #21 | Exceptional 1.5% |
| Alaska Natives | 100.0 /100 | #22 | Exceptional 1.5% |
| Europeans | 100.0 /100 | #23 | Exceptional 1.5% |
| Pennsylvania Germans | 100.0 /100 | #24 | Exceptional 1.5% |
| French | 100.0 /100 | #25 | Exceptional 1.5% |
| Czechs | 100.0 /100 | #26 | Exceptional 1.5% |
| Scandinavians | 100.0 /100 | #27 | Exceptional 1.5% |
| French Canadians | 100.0 /100 | #28 | Exceptional 1.5% |
| Lumbee | 100.0 /100 | #29 | Exceptional 1.5% |
| British | 100.0 /100 | #30 | Exceptional 1.5% |
| Inupiat | 100.0 /100 | #31 | Exceptional 1.5% |
| Swiss | 100.0 /100 | #32 | Exceptional 1.5% |
| Italians | 100.0 /100 | #33 | Exceptional 1.5% |
| Latvians | 100.0 /100 | #34 | Exceptional 1.5% |
Demographics Similar to Assyrians/Chaldeans/Syriacs by No Schooling Completed
In terms of no schooling completed, the demographic groups most similar to Assyrians/Chaldeans/Syriacs are Immigrants from South America (2.5%, a difference of 0.030%), Immigrants from Jamaica (2.5%, a difference of 0.060%), Immigrants from Ethiopia (2.5%, a difference of 0.11%), Armenian (2.5%, a difference of 0.23%), and Immigrants from Sierra Leone (2.5%, a difference of 0.58%).
| Demographics | Rating | Rank | No Schooling Completed |
| Immigrants | Africa | 1.1 /100 | #251 | Tragic 2.4% |
| Immigrants | Colombia | 1.0 /100 | #252 | Tragic 2.4% |
| Immigrants | Asia | 0.9 /100 | #253 | Tragic 2.4% |
| Immigrants | Eastern Africa | 0.9 /100 | #254 | Tragic 2.4% |
| Ethiopians | 0.8 /100 | #255 | Tragic 2.4% |
| Yaqui | 0.8 /100 | #256 | Tragic 2.4% |
| Immigrants | South America | 0.6 /100 | #257 | Tragic 2.5% |
| Assyrians/Chaldeans/Syriacs | 0.6 /100 | #258 | Tragic 2.5% |
| Immigrants | Jamaica | 0.6 /100 | #259 | Tragic 2.5% |
| Immigrants | Ethiopia | 0.6 /100 | #260 | Tragic 2.5% |
| Armenians | 0.5 /100 | #261 | Tragic 2.5% |
| Immigrants | Sierra Leone | 0.5 /100 | #262 | Tragic 2.5% |
| Immigrants | Liberia | 0.4 /100 | #263 | Tragic 2.5% |
| Indians (Asian) | 0.4 /100 | #264 | Tragic 2.5% |
| West Indians | 0.4 /100 | #265 | Tragic 2.5% |