Guamanian/Chamorro vs Cheyenne No Schooling Completed
COMPARE
Guamanian/Chamorro
Cheyenne
No Schooling Completed
No Schooling Completed Comparison
Guamanians/Chamorros
Cheyenne
2.2%
NO SCHOOLING COMPLETED
29.8/ 100
METRIC RATING
192nd/ 347
METRIC RANK
2.1%
NO SCHOOLING COMPLETED
58.6/ 100
METRIC RATING
168th/ 347
METRIC RANK
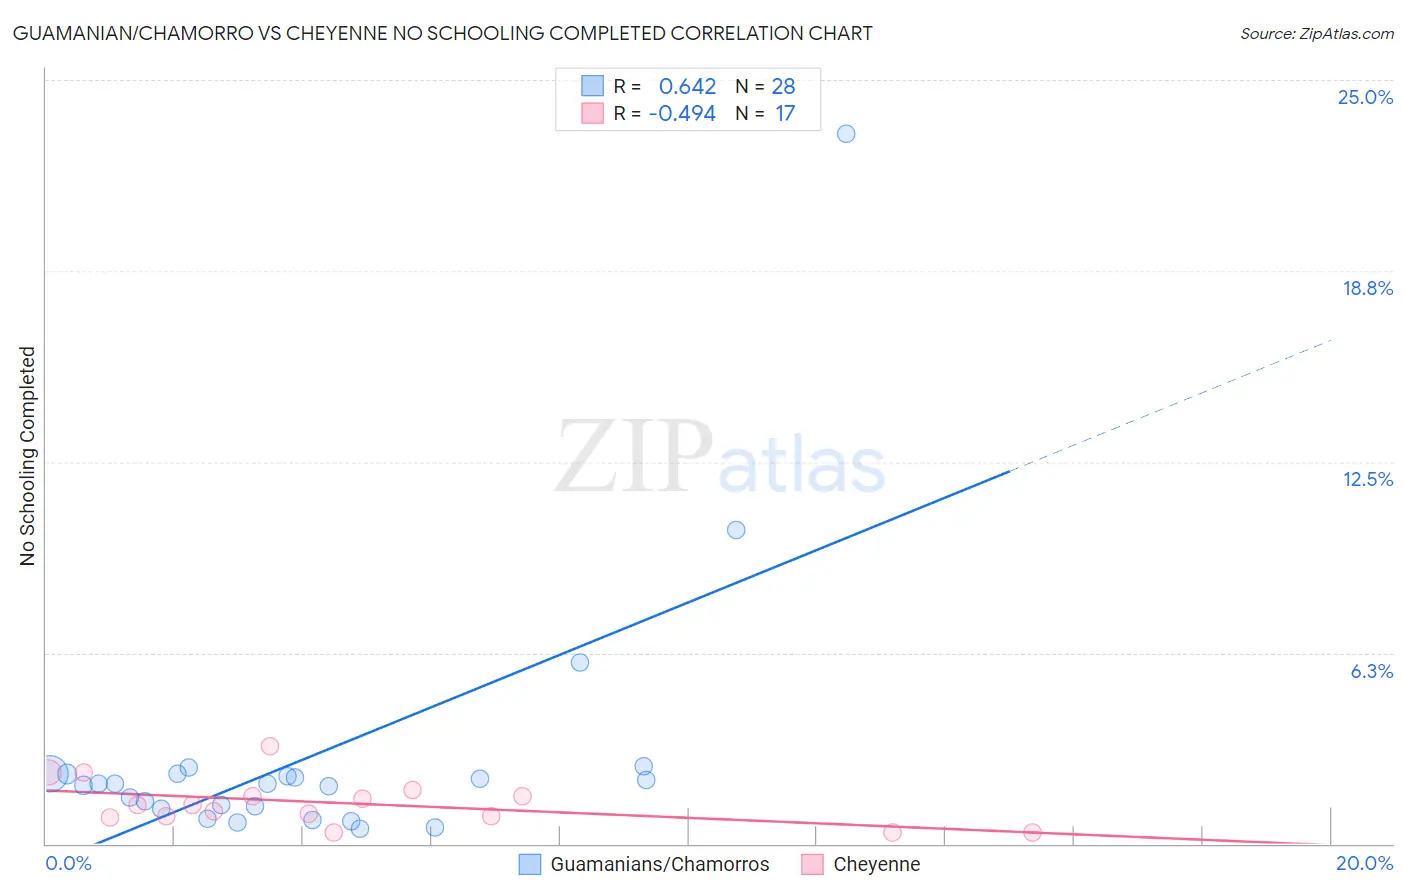
Guamanian/Chamorro vs Cheyenne No Schooling Completed Correlation Chart
The statistical analysis conducted on geographies consisting of 220,951,365 people shows a significant positive correlation between the proportion of Guamanians/Chamorros and percentage of population with no schooling in the United States with a correlation coefficient (R) of 0.642 and weighted average of 2.2%. Similarly, the statistical analysis conducted on geographies consisting of 80,362,041 people shows a moderate negative correlation between the proportion of Cheyenne and percentage of population with no schooling in the United States with a correlation coefficient (R) of -0.494 and weighted average of 2.1%, a difference of 4.1%.
No Schooling Completed Correlation Summary
| Measurement | Guamanian/Chamorro | Cheyenne |
| Minimum | 0.47% | 0.36% |
| Maximum | 23.2% | 3.2% |
| Range | 22.8% | 2.8% |
| Mean | 2.9% | 1.3% |
| Median | 2.0% | 1.3% |
| Interquartile 25% (IQ1) | 1.2% | 0.88% |
| Interquartile 75% (IQ3) | 2.3% | 1.7% |
| Interquartile Range (IQR) | 1.1% | 0.78% |
| Standard Deviation (Sample) | 4.4% | 0.76% |
| Standard Deviation (Population) | 4.3% | 0.74% |
Similar Demographics by No Schooling Completed
Demographics Similar to Guamanians/Chamorros by No Schooling Completed
In terms of no schooling completed, the demographic groups most similar to Guamanians/Chamorros are Paraguayan (2.2%, a difference of 0.080%), Bermudan (2.1%, a difference of 0.14%), Immigrants from Albania (2.2%, a difference of 0.24%), Spanish American (2.1%, a difference of 0.43%), and Hawaiian (2.2%, a difference of 0.44%).
| Demographics | Rating | Rank | No Schooling Completed |
| Mongolians | 40.8 /100 | #185 | Average 2.1% |
| Immigrants | Bosnia and Herzegovina | 38.6 /100 | #186 | Fair 2.1% |
| Navajo | 36.5 /100 | #187 | Fair 2.1% |
| Immigrants | Kenya | 36.2 /100 | #188 | Fair 2.1% |
| Immigrants | Egypt | 36.1 /100 | #189 | Fair 2.1% |
| Spanish Americans | 32.6 /100 | #190 | Fair 2.1% |
| Bermudans | 30.7 /100 | #191 | Fair 2.1% |
| Guamanians/Chamorros | 29.8 /100 | #192 | Fair 2.2% |
| Paraguayans | 29.3 /100 | #193 | Fair 2.2% |
| Immigrants | Albania | 28.3 /100 | #194 | Fair 2.2% |
| Hawaiians | 27.0 /100 | #195 | Fair 2.2% |
| Immigrants | Ukraine | 26.1 /100 | #196 | Fair 2.2% |
| Immigrants | Southern Europe | 23.8 /100 | #197 | Fair 2.2% |
| Immigrants | Chile | 22.7 /100 | #198 | Fair 2.2% |
| Africans | 21.8 /100 | #199 | Fair 2.2% |
Demographics Similar to Cheyenne by No Schooling Completed
In terms of no schooling completed, the demographic groups most similar to Cheyenne are Egyptian (2.1%, a difference of 0.080%), Dutch West Indian (2.1%, a difference of 0.18%), Brazilian (2.1%, a difference of 0.23%), Apache (2.1%, a difference of 0.27%), and Comanche (2.1%, a difference of 0.29%).
| Demographics | Rating | Rank | No Schooling Completed |
| Ugandans | 64.6 /100 | #161 | Good 2.0% |
| Immigrants | Brazil | 63.8 /100 | #162 | Good 2.1% |
| Albanians | 62.2 /100 | #163 | Good 2.1% |
| Comanche | 60.7 /100 | #164 | Good 2.1% |
| Brazilians | 60.2 /100 | #165 | Good 2.1% |
| Dutch West Indians | 59.9 /100 | #166 | Average 2.1% |
| Egyptians | 59.2 /100 | #167 | Average 2.1% |
| Cheyenne | 58.6 /100 | #168 | Average 2.1% |
| Apache | 56.7 /100 | #169 | Average 2.1% |
| Argentineans | 56.0 /100 | #170 | Average 2.1% |
| Immigrants | Poland | 55.2 /100 | #171 | Average 2.1% |
| Immigrants | Argentina | 52.7 /100 | #172 | Average 2.1% |
| Immigrants | Belarus | 51.8 /100 | #173 | Average 2.1% |
| Immigrants | Micronesia | 50.0 /100 | #174 | Average 2.1% |
| Arabs | 46.4 /100 | #175 | Average 2.1% |