Scandinavian vs German No Schooling Completed
COMPARE
Scandinavian
German
No Schooling Completed
No Schooling Completed Comparison
Scandinavians
Germans
1.5%
NO SCHOOLING COMPLETED
100.0/ 100
METRIC RATING
27th/ 347
METRIC RANK
1.4%
NO SCHOOLING COMPLETED
100.0/ 100
METRIC RATING
4th/ 347
METRIC RANK
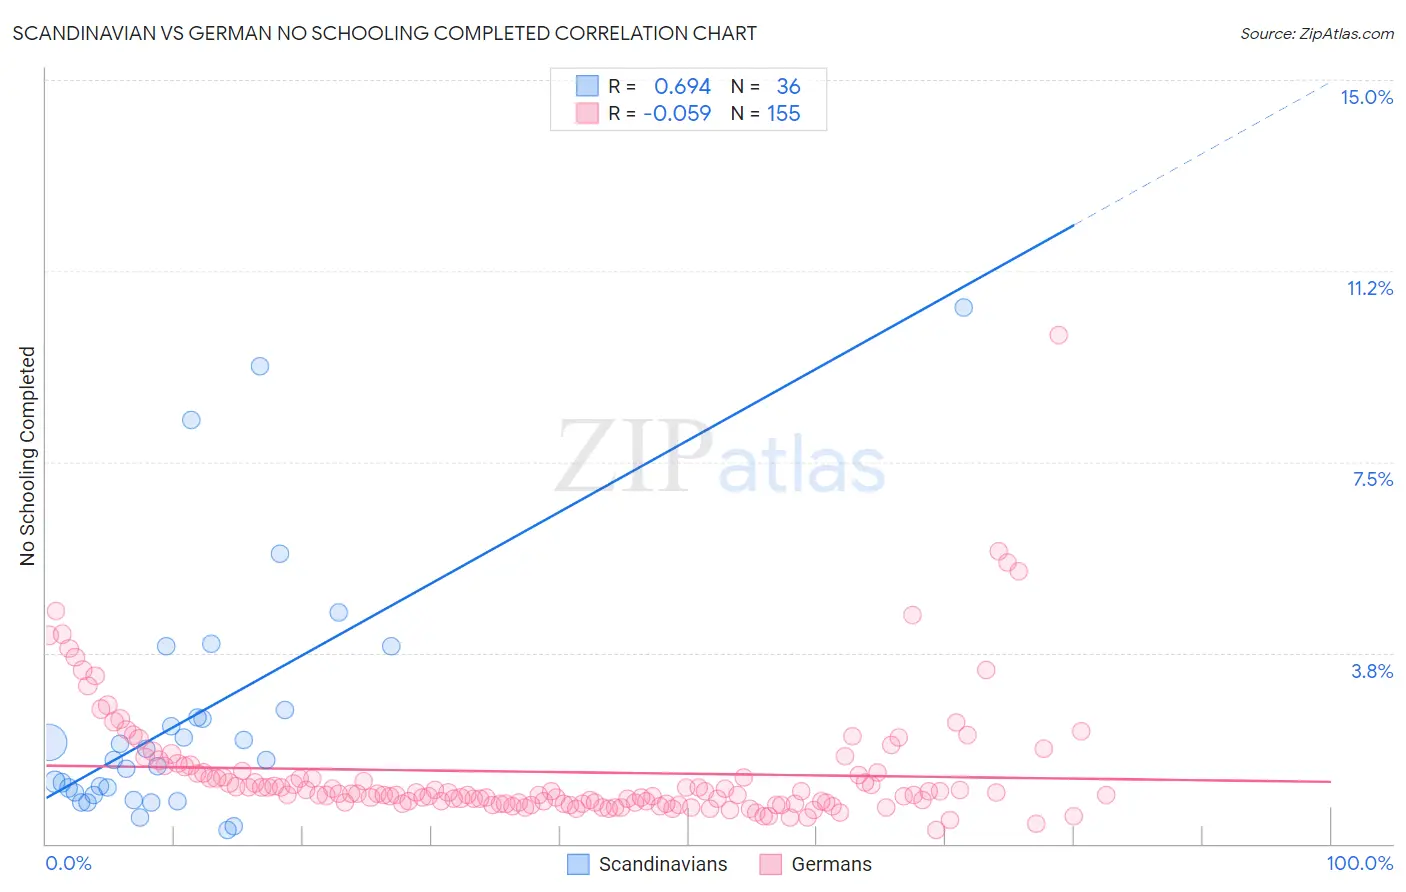
Scandinavian vs German No Schooling Completed Correlation Chart
The statistical analysis conducted on geographies consisting of 462,495,529 people shows a significant positive correlation between the proportion of Scandinavians and percentage of population with no schooling in the United States with a correlation coefficient (R) of 0.694 and weighted average of 1.5%. Similarly, the statistical analysis conducted on geographies consisting of 559,407,426 people shows a slight negative correlation between the proportion of Germans and percentage of population with no schooling in the United States with a correlation coefficient (R) of -0.059 and weighted average of 1.4%, a difference of 10.6%.
No Schooling Completed Correlation Summary
| Measurement | Scandinavian | German |
| Minimum | 0.27% | 0.26% |
| Maximum | 10.5% | 10.0% |
| Range | 10.3% | 9.7% |
| Mean | 2.5% | 1.4% |
| Median | 1.6% | 0.98% |
| Interquartile 25% (IQ1) | 0.98% | 0.80% |
| Interquartile 75% (IQ3) | 2.6% | 1.4% |
| Interquartile Range (IQR) | 1.6% | 0.61% |
| Standard Deviation (Sample) | 2.5% | 1.2% |
| Standard Deviation (Population) | 2.4% | 1.2% |
Similar Demographics by No Schooling Completed
Demographics Similar to Scandinavians by No Schooling Completed
In terms of no schooling completed, the demographic groups most similar to Scandinavians are French Canadian (1.5%, a difference of 0.010%), Czech (1.5%, a difference of 0.53%), Lumbee (1.5%, a difference of 0.92%), French (1.5%, a difference of 1.1%), and Pennsylvania German (1.5%, a difference of 1.1%).
| Demographics | Rating | Rank | No Schooling Completed |
| Welsh | 100.0 /100 | #20 | Exceptional 1.5% |
| Chinese | 100.0 /100 | #21 | Exceptional 1.5% |
| Alaska Natives | 100.0 /100 | #22 | Exceptional 1.5% |
| Europeans | 100.0 /100 | #23 | Exceptional 1.5% |
| Pennsylvania Germans | 100.0 /100 | #24 | Exceptional 1.5% |
| French | 100.0 /100 | #25 | Exceptional 1.5% |
| Czechs | 100.0 /100 | #26 | Exceptional 1.5% |
| Scandinavians | 100.0 /100 | #27 | Exceptional 1.5% |
| French Canadians | 100.0 /100 | #28 | Exceptional 1.5% |
| Lumbee | 100.0 /100 | #29 | Exceptional 1.5% |
| British | 100.0 /100 | #30 | Exceptional 1.5% |
| Inupiat | 100.0 /100 | #31 | Exceptional 1.5% |
| Swiss | 100.0 /100 | #32 | Exceptional 1.5% |
| Italians | 100.0 /100 | #33 | Exceptional 1.5% |
| Latvians | 100.0 /100 | #34 | Exceptional 1.5% |
Demographics Similar to Germans by No Schooling Completed
In terms of no schooling completed, the demographic groups most similar to Germans are Slovene (1.4%, a difference of 0.42%), Norwegian (1.3%, a difference of 0.56%), Slovak (1.3%, a difference of 0.99%), Carpatho Rusyn (1.4%, a difference of 1.2%), and English (1.4%, a difference of 2.2%).
| Demographics | Rating | Rank | No Schooling Completed |
| Yup'ik | 100.0 /100 | #1 | Exceptional 1.2% |
| Slovaks | 100.0 /100 | #2 | Exceptional 1.3% |
| Norwegians | 100.0 /100 | #3 | Exceptional 1.3% |
| Germans | 100.0 /100 | #4 | Exceptional 1.4% |
| Slovenes | 100.0 /100 | #5 | Exceptional 1.4% |
| Carpatho Rusyns | 100.0 /100 | #6 | Exceptional 1.4% |
| English | 100.0 /100 | #7 | Exceptional 1.4% |
| Swedes | 100.0 /100 | #8 | Exceptional 1.4% |
| Scottish | 100.0 /100 | #9 | Exceptional 1.4% |
| Dutch | 100.0 /100 | #10 | Exceptional 1.4% |
| Lithuanians | 100.0 /100 | #11 | Exceptional 1.4% |
| Irish | 100.0 /100 | #12 | Exceptional 1.4% |
| Poles | 100.0 /100 | #13 | Exceptional 1.4% |
| Scotch-Irish | 100.0 /100 | #14 | Exceptional 1.5% |
| Tlingit-Haida | 100.0 /100 | #15 | Exceptional 1.5% |