Scandinavian vs Moroccan Master's Degree
COMPARE
Scandinavian
Moroccan
Master's Degree
Master's Degree Comparison
Scandinavians
Moroccans
14.4%
MASTER'S DEGREE
23.3/ 100
METRIC RATING
206th/ 347
METRIC RANK
16.8%
MASTER'S DEGREE
98.0/ 100
METRIC RATING
109th/ 347
METRIC RANK
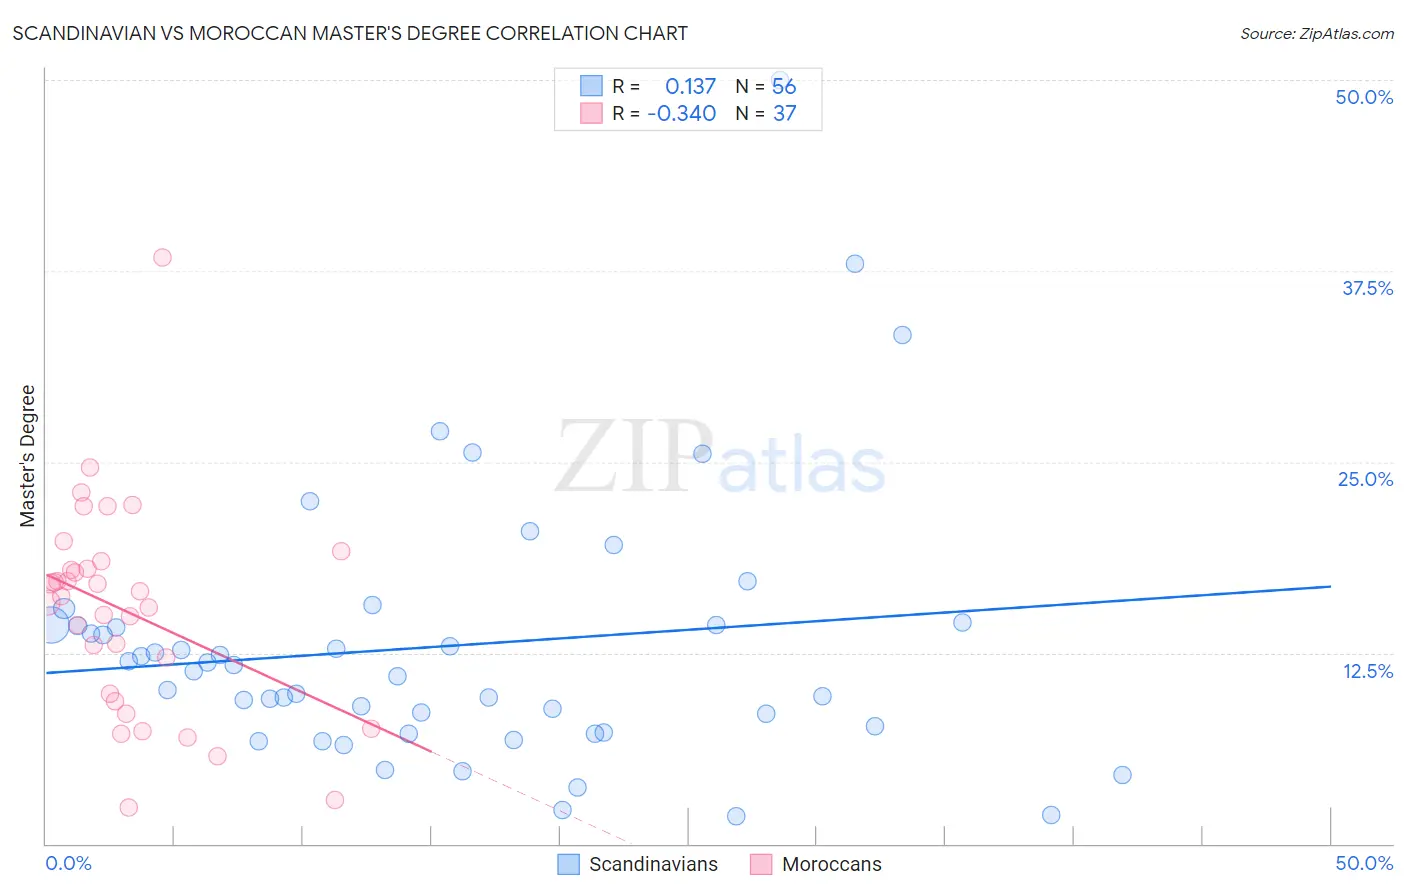
Scandinavian vs Moroccan Master's Degree Correlation Chart
The statistical analysis conducted on geographies consisting of 472,399,966 people shows a poor positive correlation between the proportion of Scandinavians and percentage of population with at least master's degree education in the United States with a correlation coefficient (R) of 0.137 and weighted average of 14.4%. Similarly, the statistical analysis conducted on geographies consisting of 201,797,858 people shows a mild negative correlation between the proportion of Moroccans and percentage of population with at least master's degree education in the United States with a correlation coefficient (R) of -0.340 and weighted average of 16.8%, a difference of 16.9%.
Master's Degree Correlation Summary
| Measurement | Scandinavian | Moroccan |
| Minimum | 1.8% | 2.4% |
| Maximum | 50.0% | 38.4% |
| Range | 48.2% | 36.0% |
| Mean | 12.9% | 15.2% |
| Median | 11.5% | 16.2% |
| Interquartile 25% (IQ1) | 7.5% | 9.6% |
| Interquartile 75% (IQ3) | 14.3% | 18.2% |
| Interquartile Range (IQR) | 6.8% | 8.7% |
| Standard Deviation (Sample) | 8.8% | 6.9% |
| Standard Deviation (Population) | 8.7% | 6.8% |
Similar Demographics by Master's Degree
Demographics Similar to Scandinavians by Master's Degree
In terms of master's degree, the demographic groups most similar to Scandinavians are Trinidadian and Tobagonian (14.4%, a difference of 0.040%), French (14.4%, a difference of 0.070%), Yugoslavian (14.4%, a difference of 0.18%), Immigrants from Bosnia and Herzegovina (14.3%, a difference of 0.25%), and Immigrants from Western Africa (14.4%, a difference of 0.30%).
| Demographics | Rating | Rank | Master's Degree |
| Immigrants | Armenia | 27.2 /100 | #199 | Fair 14.5% |
| Panamanians | 25.1 /100 | #200 | Fair 14.4% |
| Scotch-Irish | 25.0 /100 | #201 | Fair 14.4% |
| Immigrants | Western Africa | 24.9 /100 | #202 | Fair 14.4% |
| Yugoslavians | 24.3 /100 | #203 | Fair 14.4% |
| French | 23.7 /100 | #204 | Fair 14.4% |
| Trinidadians and Tobagonians | 23.5 /100 | #205 | Fair 14.4% |
| Scandinavians | 23.3 /100 | #206 | Fair 14.4% |
| Immigrants | Bosnia and Herzegovina | 22.0 /100 | #207 | Fair 14.3% |
| Immigrants | Barbados | 20.5 /100 | #208 | Fair 14.3% |
| Immigrants | Panama | 20.0 /100 | #209 | Fair 14.3% |
| Sub-Saharan Africans | 19.4 /100 | #210 | Poor 14.2% |
| Somalis | 18.0 /100 | #211 | Poor 14.2% |
| Spanish | 17.8 /100 | #212 | Poor 14.2% |
| Immigrants | Thailand | 17.0 /100 | #213 | Poor 14.2% |
Demographics Similar to Moroccans by Master's Degree
In terms of master's degree, the demographic groups most similar to Moroccans are Sierra Leonean (16.8%, a difference of 0.020%), Immigrants from Chile (16.8%, a difference of 0.030%), Armenian (16.8%, a difference of 0.050%), Immigrants from Albania (16.8%, a difference of 0.14%), and Austrian (16.7%, a difference of 0.30%).
| Demographics | Rating | Rank | Master's Degree |
| Chileans | 98.6 /100 | #102 | Exceptional 16.9% |
| Alsatians | 98.4 /100 | #103 | Exceptional 16.9% |
| Ukrainians | 98.3 /100 | #104 | Exceptional 16.9% |
| Syrians | 98.3 /100 | #105 | Exceptional 16.8% |
| Immigrants | Albania | 98.1 /100 | #106 | Exceptional 16.8% |
| Armenians | 98.0 /100 | #107 | Exceptional 16.8% |
| Sierra Leoneans | 98.0 /100 | #108 | Exceptional 16.8% |
| Moroccans | 98.0 /100 | #109 | Exceptional 16.8% |
| Immigrants | Chile | 98.0 /100 | #110 | Exceptional 16.8% |
| Austrians | 97.8 /100 | #111 | Exceptional 16.7% |
| Macedonians | 97.7 /100 | #112 | Exceptional 16.7% |
| Arabs | 97.7 /100 | #113 | Exceptional 16.7% |
| Northern Europeans | 97.6 /100 | #114 | Exceptional 16.7% |
| Immigrants | Uganda | 97.3 /100 | #115 | Exceptional 16.6% |
| Immigrants | Southern Europe | 97.2 /100 | #116 | Exceptional 16.6% |