Scandinavian vs Czechoslovakian Master's Degree
COMPARE
Scandinavian
Czechoslovakian
Master's Degree
Master's Degree Comparison
Scandinavians
Czechoslovakians
14.4%
MASTER'S DEGREE
23.3/ 100
METRIC RATING
206th/ 347
METRIC RANK
14.5%
MASTER'S DEGREE
29.9/ 100
METRIC RATING
196th/ 347
METRIC RANK
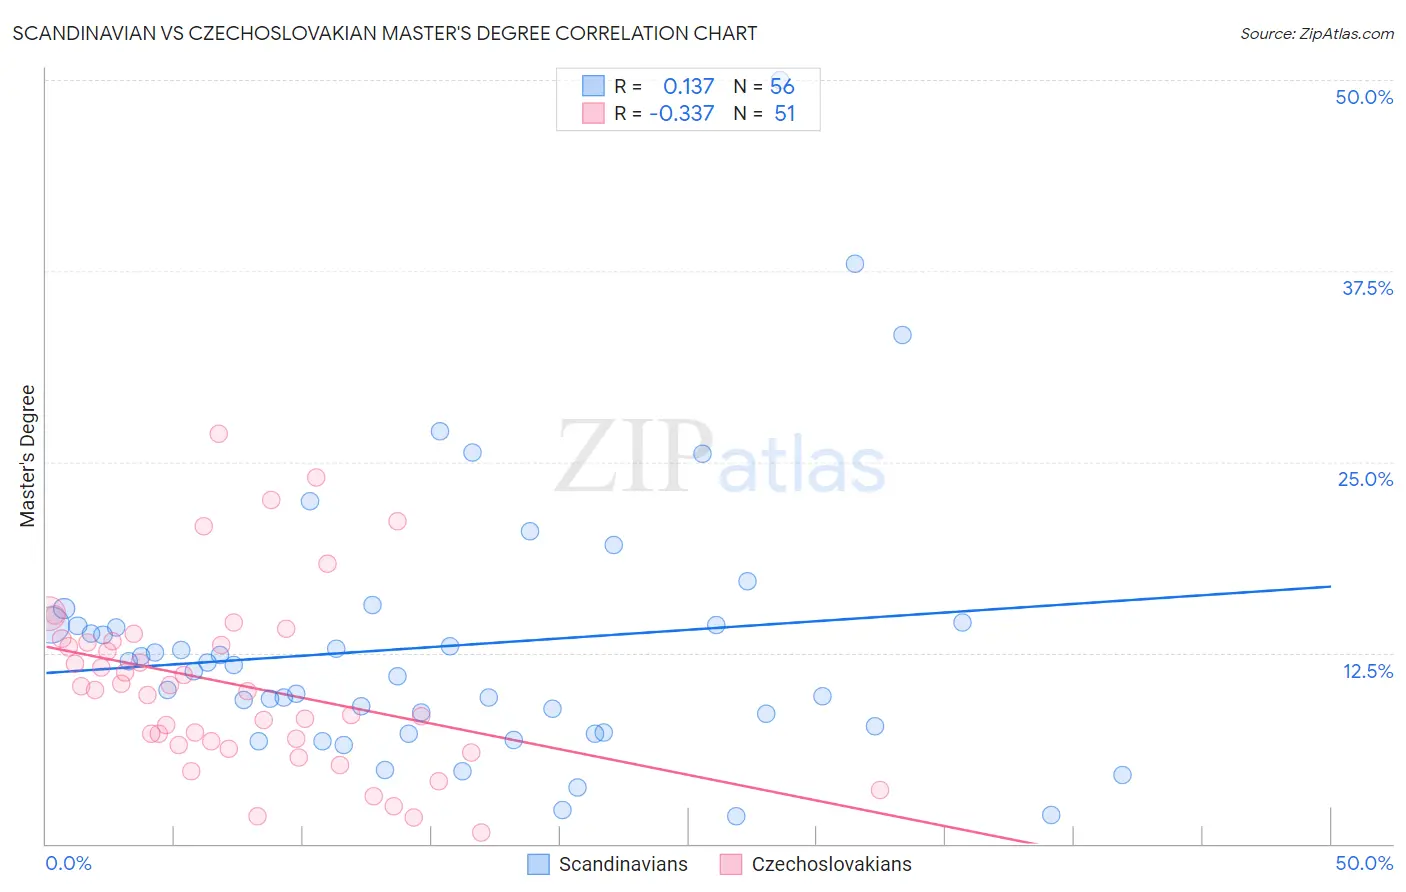
Scandinavian vs Czechoslovakian Master's Degree Correlation Chart
The statistical analysis conducted on geographies consisting of 472,399,966 people shows a poor positive correlation between the proportion of Scandinavians and percentage of population with at least master's degree education in the United States with a correlation coefficient (R) of 0.137 and weighted average of 14.4%. Similarly, the statistical analysis conducted on geographies consisting of 368,562,573 people shows a mild negative correlation between the proportion of Czechoslovakians and percentage of population with at least master's degree education in the United States with a correlation coefficient (R) of -0.337 and weighted average of 14.5%, a difference of 1.1%.
Master's Degree Correlation Summary
| Measurement | Scandinavian | Czechoslovakian |
| Minimum | 1.8% | 0.78% |
| Maximum | 50.0% | 26.9% |
| Range | 48.2% | 26.1% |
| Mean | 12.9% | 10.4% |
| Median | 11.5% | 10.0% |
| Interquartile 25% (IQ1) | 7.5% | 6.4% |
| Interquartile 75% (IQ3) | 14.3% | 13.3% |
| Interquartile Range (IQR) | 6.8% | 6.8% |
| Standard Deviation (Sample) | 8.8% | 5.8% |
| Standard Deviation (Population) | 8.7% | 5.7% |
Demographics Similar to Scandinavians and Czechoslovakians by Master's Degree
In terms of master's degree, the demographic groups most similar to Scandinavians are Trinidadian and Tobagonian (14.4%, a difference of 0.040%), French (14.4%, a difference of 0.070%), Yugoslavian (14.4%, a difference of 0.18%), Immigrants from Bosnia and Herzegovina (14.3%, a difference of 0.25%), and Immigrants from Western Africa (14.4%, a difference of 0.30%). Similarly, the demographic groups most similar to Czechoslovakians are Danish (14.5%, a difference of 0.22%), Belgian (14.5%, a difference of 0.31%), Chinese (14.6%, a difference of 0.39%), West Indian (14.5%, a difference of 0.41%), and Immigrants from Nigeria (14.6%, a difference of 0.43%).
| Demographics | Rating | Rank | Master's Degree |
| Welsh | 34.2 /100 | #191 | Fair 14.6% |
| Immigrants | Middle Africa | 33.6 /100 | #192 | Fair 14.6% |
| Immigrants | Nigeria | 32.7 /100 | #193 | Fair 14.6% |
| Chinese | 32.5 /100 | #194 | Fair 14.6% |
| Danes | 31.3 /100 | #195 | Fair 14.5% |
| Czechoslovakians | 29.9 /100 | #196 | Fair 14.5% |
| Belgians | 28.0 /100 | #197 | Fair 14.5% |
| West Indians | 27.4 /100 | #198 | Fair 14.5% |
| Immigrants | Armenia | 27.2 /100 | #199 | Fair 14.5% |
| Panamanians | 25.1 /100 | #200 | Fair 14.4% |
| Scotch-Irish | 25.0 /100 | #201 | Fair 14.4% |
| Immigrants | Western Africa | 24.9 /100 | #202 | Fair 14.4% |
| Yugoslavians | 24.3 /100 | #203 | Fair 14.4% |
| French | 23.7 /100 | #204 | Fair 14.4% |
| Trinidadians and Tobagonians | 23.5 /100 | #205 | Fair 14.4% |
| Scandinavians | 23.3 /100 | #206 | Fair 14.4% |
| Immigrants | Bosnia and Herzegovina | 22.0 /100 | #207 | Fair 14.3% |
| Immigrants | Barbados | 20.5 /100 | #208 | Fair 14.3% |
| Immigrants | Panama | 20.0 /100 | #209 | Fair 14.3% |
| Sub-Saharan Africans | 19.4 /100 | #210 | Poor 14.2% |
| Somalis | 18.0 /100 | #211 | Poor 14.2% |