Scandinavian vs Native Hawaiian Master's Degree
COMPARE
Scandinavian
Native Hawaiian
Master's Degree
Master's Degree Comparison
Scandinavians
Native Hawaiians
14.4%
MASTER'S DEGREE
23.3/ 100
METRIC RATING
206th/ 347
METRIC RANK
12.3%
MASTER'S DEGREE
0.4/ 100
METRIC RATING
268th/ 347
METRIC RANK
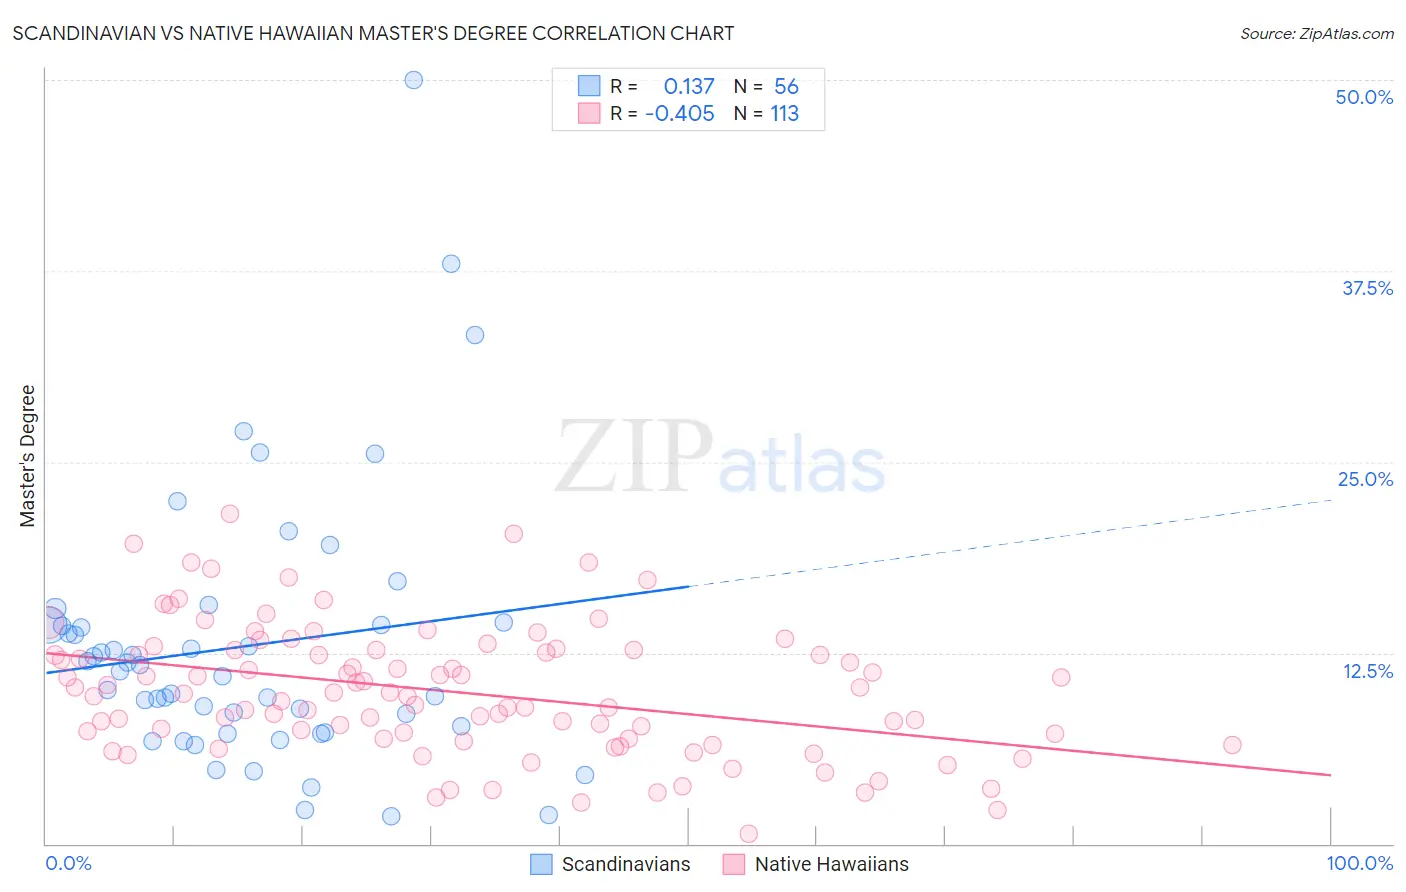
Scandinavian vs Native Hawaiian Master's Degree Correlation Chart
The statistical analysis conducted on geographies consisting of 472,399,966 people shows a poor positive correlation between the proportion of Scandinavians and percentage of population with at least master's degree education in the United States with a correlation coefficient (R) of 0.137 and weighted average of 14.4%. Similarly, the statistical analysis conducted on geographies consisting of 331,993,675 people shows a moderate negative correlation between the proportion of Native Hawaiians and percentage of population with at least master's degree education in the United States with a correlation coefficient (R) of -0.405 and weighted average of 12.3%, a difference of 17.0%.
Master's Degree Correlation Summary
| Measurement | Scandinavian | Native Hawaiian |
| Minimum | 1.8% | 0.67% |
| Maximum | 50.0% | 21.6% |
| Range | 48.2% | 20.9% |
| Mean | 12.9% | 10.0% |
| Median | 11.5% | 9.8% |
| Interquartile 25% (IQ1) | 7.5% | 6.9% |
| Interquartile 75% (IQ3) | 14.3% | 12.7% |
| Interquartile Range (IQR) | 6.8% | 5.8% |
| Standard Deviation (Sample) | 8.8% | 4.2% |
| Standard Deviation (Population) | 8.7% | 4.2% |
Similar Demographics by Master's Degree
Demographics Similar to Scandinavians by Master's Degree
In terms of master's degree, the demographic groups most similar to Scandinavians are Trinidadian and Tobagonian (14.4%, a difference of 0.040%), French (14.4%, a difference of 0.070%), Yugoslavian (14.4%, a difference of 0.18%), Immigrants from Bosnia and Herzegovina (14.3%, a difference of 0.25%), and Immigrants from Western Africa (14.4%, a difference of 0.30%).
| Demographics | Rating | Rank | Master's Degree |
| Immigrants | Armenia | 27.2 /100 | #199 | Fair 14.5% |
| Panamanians | 25.1 /100 | #200 | Fair 14.4% |
| Scotch-Irish | 25.0 /100 | #201 | Fair 14.4% |
| Immigrants | Western Africa | 24.9 /100 | #202 | Fair 14.4% |
| Yugoslavians | 24.3 /100 | #203 | Fair 14.4% |
| French | 23.7 /100 | #204 | Fair 14.4% |
| Trinidadians and Tobagonians | 23.5 /100 | #205 | Fair 14.4% |
| Scandinavians | 23.3 /100 | #206 | Fair 14.4% |
| Immigrants | Bosnia and Herzegovina | 22.0 /100 | #207 | Fair 14.3% |
| Immigrants | Barbados | 20.5 /100 | #208 | Fair 14.3% |
| Immigrants | Panama | 20.0 /100 | #209 | Fair 14.3% |
| Sub-Saharan Africans | 19.4 /100 | #210 | Poor 14.2% |
| Somalis | 18.0 /100 | #211 | Poor 14.2% |
| Spanish | 17.8 /100 | #212 | Poor 14.2% |
| Immigrants | Thailand | 17.0 /100 | #213 | Poor 14.2% |
Demographics Similar to Native Hawaiians by Master's Degree
In terms of master's degree, the demographic groups most similar to Native Hawaiians are American (12.3%, a difference of 0.25%), Central American (12.2%, a difference of 0.65%), Salvadoran (12.2%, a difference of 0.78%), Bahamian (12.4%, a difference of 1.0%), and Immigrants from Fiji (12.4%, a difference of 1.2%).
| Demographics | Rating | Rank | Master's Degree |
| Tongans | 0.6 /100 | #261 | Tragic 12.5% |
| Nicaraguans | 0.6 /100 | #262 | Tragic 12.5% |
| Central American Indians | 0.5 /100 | #263 | Tragic 12.4% |
| Belizeans | 0.5 /100 | #264 | Tragic 12.4% |
| Immigrants | Fiji | 0.5 /100 | #265 | Tragic 12.4% |
| Bahamians | 0.5 /100 | #266 | Tragic 12.4% |
| Americans | 0.4 /100 | #267 | Tragic 12.3% |
| Native Hawaiians | 0.4 /100 | #268 | Tragic 12.3% |
| Central Americans | 0.3 /100 | #269 | Tragic 12.2% |
| Salvadorans | 0.3 /100 | #270 | Tragic 12.2% |
| Haitians | 0.3 /100 | #271 | Tragic 12.1% |
| Comanche | 0.3 /100 | #272 | Tragic 12.1% |
| Blackfeet | 0.3 /100 | #273 | Tragic 12.1% |
| Cape Verdeans | 0.3 /100 | #274 | Tragic 12.1% |
| Cubans | 0.3 /100 | #275 | Tragic 12.1% |