Samoan vs Japanese Unemployment Among Ages 55 to 59 years
COMPARE
Samoan
Japanese
Unemployment Among Ages 55 to 59 years
Unemployment Among Ages 55 to 59 years Comparison
Samoans
Japanese
4.8%
UNEMPLOYMENT AMONG AGES 55 TO 59 YEARS
47.1/ 100
METRIC RATING
176th/ 347
METRIC RANK
4.8%
UNEMPLOYMENT AMONG AGES 55 TO 59 YEARS
54.5/ 100
METRIC RATING
171st/ 347
METRIC RANK
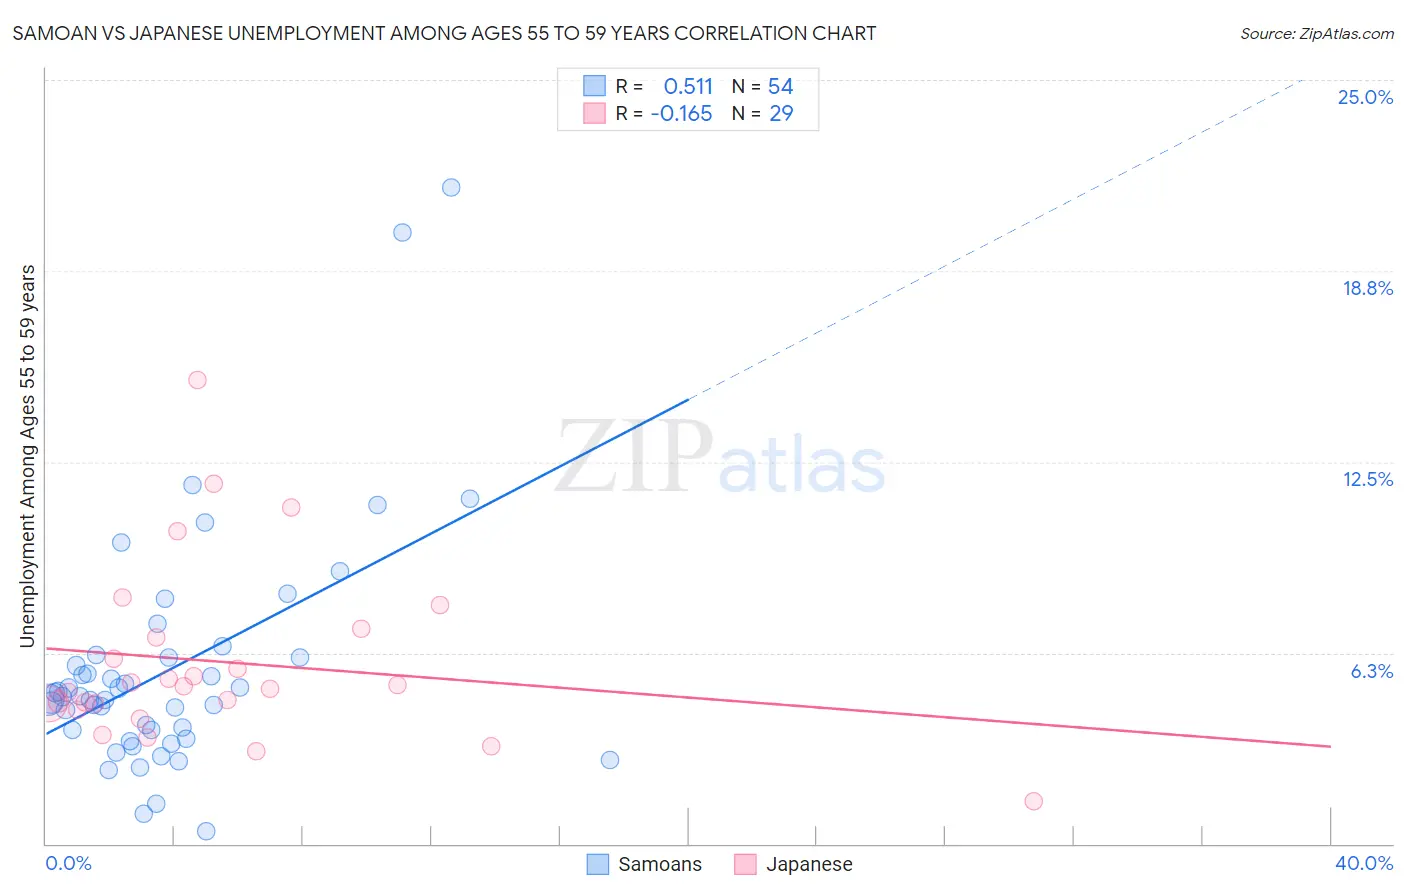
Samoan vs Japanese Unemployment Among Ages 55 to 59 years Correlation Chart
The statistical analysis conducted on geographies consisting of 215,866,418 people shows a substantial positive correlation between the proportion of Samoans and unemployment rate among population between the ages 55 and 59 in the United States with a correlation coefficient (R) of 0.511 and weighted average of 4.8%. Similarly, the statistical analysis conducted on geographies consisting of 239,768,181 people shows a poor negative correlation between the proportion of Japanese and unemployment rate among population between the ages 55 and 59 in the United States with a correlation coefficient (R) of -0.165 and weighted average of 4.8%, a difference of 0.30%.
Unemployment Among Ages 55 to 59 years Correlation Summary
| Measurement | Samoan | Japanese |
| Minimum | 0.40% | 1.4% |
| Maximum | 21.5% | 15.2% |
| Range | 21.1% | 13.8% |
| Mean | 5.7% | 5.9% |
| Median | 4.8% | 5.1% |
| Interquartile 25% (IQ1) | 3.7% | 4.5% |
| Interquartile 75% (IQ3) | 6.1% | 6.9% |
| Interquartile Range (IQR) | 2.4% | 2.4% |
| Standard Deviation (Sample) | 3.9% | 2.9% |
| Standard Deviation (Population) | 3.8% | 2.9% |
Demographics Similar to Samoans and Japanese by Unemployment Among Ages 55 to 59 years
In terms of unemployment among ages 55 to 59 years, the demographic groups most similar to Samoans are Immigrants from Sri Lanka (4.8%, a difference of 0.010%), Australian (4.8%, a difference of 0.060%), Arab (4.8%, a difference of 0.10%), Immigrants from Croatia (4.8%, a difference of 0.12%), and Hungarian (4.8%, a difference of 0.12%). Similarly, the demographic groups most similar to Japanese are Nicaraguan (4.8%, a difference of 0.020%), Uruguayan (4.8%, a difference of 0.050%), Immigrants from Eastern Europe (4.8%, a difference of 0.090%), Immigrants from Sudan (4.8%, a difference of 0.16%), and Immigrants from Croatia (4.8%, a difference of 0.18%).
| Demographics | Rating | Rank | Unemployment Among Ages 55 to 59 years |
| Immigrants | Lebanon | 63.8 /100 | #163 | Good 4.8% |
| Americans | 63.3 /100 | #164 | Good 4.8% |
| Immigrants | France | 62.0 /100 | #165 | Good 4.8% |
| Potawatomi | 62.0 /100 | #166 | Good 4.8% |
| Immigrants | Western Europe | 60.4 /100 | #167 | Good 4.8% |
| Immigrants | Cambodia | 59.3 /100 | #168 | Average 4.8% |
| Immigrants | Sudan | 58.4 /100 | #169 | Average 4.8% |
| Uruguayans | 55.6 /100 | #170 | Average 4.8% |
| Japanese | 54.5 /100 | #171 | Average 4.8% |
| Nicaraguans | 54.0 /100 | #172 | Average 4.8% |
| Immigrants | Eastern Europe | 52.2 /100 | #173 | Average 4.8% |
| Immigrants | Croatia | 50.0 /100 | #174 | Average 4.8% |
| Australians | 48.6 /100 | #175 | Average 4.8% |
| Samoans | 47.1 /100 | #176 | Average 4.8% |
| Immigrants | Sri Lanka | 46.8 /100 | #177 | Average 4.8% |
| Arabs | 44.7 /100 | #178 | Average 4.8% |
| Hungarians | 44.3 /100 | #179 | Average 4.8% |
| South Americans | 44.0 /100 | #180 | Average 4.8% |
| Immigrants | Hungary | 40.4 /100 | #181 | Average 4.8% |
| Immigrants | Europe | 40.4 /100 | #182 | Average 4.8% |
| Immigrants | Peru | 38.6 /100 | #183 | Fair 4.8% |