Salvadoran vs Immigrants from Morocco 7th Grade
COMPARE
Salvadoran
Immigrants from Morocco
7th Grade
7th Grade Comparison
Salvadorans
Immigrants from Morocco
91.5%
7TH GRADE
0.0/ 100
METRIC RATING
342nd/ 347
METRIC RANK
95.8%
7TH GRADE
12.6/ 100
METRIC RATING
213th/ 347
METRIC RANK
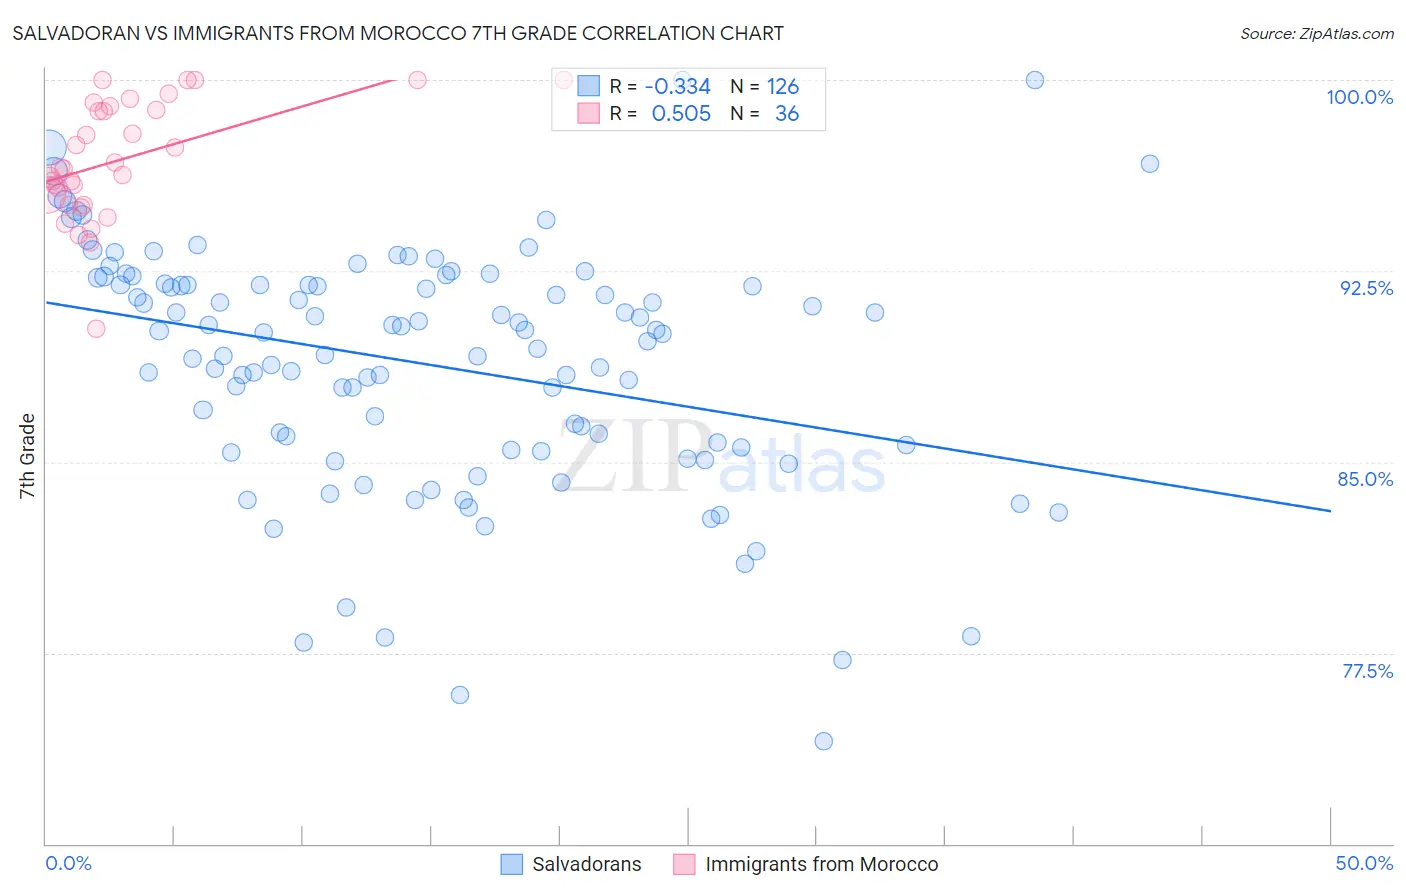
Salvadoran vs Immigrants from Morocco 7th Grade Correlation Chart
The statistical analysis conducted on geographies consisting of 399,020,248 people shows a mild negative correlation between the proportion of Salvadorans and percentage of population with at least 7th grade education in the United States with a correlation coefficient (R) of -0.334 and weighted average of 91.5%. Similarly, the statistical analysis conducted on geographies consisting of 178,910,634 people shows a substantial positive correlation between the proportion of Immigrants from Morocco and percentage of population with at least 7th grade education in the United States with a correlation coefficient (R) of 0.505 and weighted average of 95.8%, a difference of 4.7%.
7th Grade Correlation Summary
| Measurement | Salvadoran | Immigrants from Morocco |
| Minimum | 74.0% | 90.2% |
| Maximum | 100.0% | 100.0% |
| Range | 26.0% | 9.8% |
| Mean | 88.8% | 96.9% |
| Median | 90.1% | 96.5% |
| Interquartile 25% (IQ1) | 85.6% | 95.3% |
| Interquartile 75% (IQ3) | 92.0% | 98.9% |
| Interquartile Range (IQR) | 6.4% | 3.6% |
| Standard Deviation (Sample) | 4.8% | 2.3% |
| Standard Deviation (Population) | 4.8% | 2.3% |
Similar Demographics by 7th Grade
Demographics Similar to Salvadorans by 7th Grade
In terms of 7th grade, the demographic groups most similar to Salvadorans are Immigrants from Guatemala (91.3%, a difference of 0.16%), Guatemalan (91.7%, a difference of 0.27%), Yakama (91.7%, a difference of 0.29%), Mexican (91.9%, a difference of 0.49%), and Immigrants from Central America (91.0%, a difference of 0.52%).
| Demographics | Rating | Rank | 7th Grade |
| Immigrants | Armenia | 0.0 /100 | #333 | Tragic 92.7% |
| Immigrants | Yemen | 0.0 /100 | #334 | Tragic 92.6% |
| Mexican American Indians | 0.0 /100 | #335 | Tragic 92.6% |
| Immigrants | Honduras | 0.0 /100 | #336 | Tragic 92.5% |
| Immigrants | Latin America | 0.0 /100 | #337 | Tragic 92.2% |
| Central Americans | 0.0 /100 | #338 | Tragic 92.1% |
| Mexicans | 0.0 /100 | #339 | Tragic 91.9% |
| Yakama | 0.0 /100 | #340 | Tragic 91.7% |
| Guatemalans | 0.0 /100 | #341 | Tragic 91.7% |
| Salvadorans | 0.0 /100 | #342 | Tragic 91.5% |
| Immigrants | Guatemala | 0.0 /100 | #343 | Tragic 91.3% |
| Immigrants | Central America | 0.0 /100 | #344 | Tragic 91.0% |
| Immigrants | El Salvador | 0.0 /100 | #345 | Tragic 90.9% |
| Immigrants | Mexico | 0.0 /100 | #346 | Tragic 90.7% |
| Spanish American Indians | 0.0 /100 | #347 | Tragic 90.3% |
Demographics Similar to Immigrants from Morocco by 7th Grade
In terms of 7th grade, the demographic groups most similar to Immigrants from Morocco are Immigrants from Lebanon (95.8%, a difference of 0.0%), Portuguese (95.8%, a difference of 0.010%), Bahamian (95.7%, a difference of 0.010%), Dutch West Indian (95.8%, a difference of 0.040%), and Hawaiian (95.8%, a difference of 0.040%).
| Demographics | Rating | Rank | 7th Grade |
| Africans | 17.6 /100 | #206 | Poor 95.8% |
| Navajo | 17.0 /100 | #207 | Poor 95.8% |
| Immigrants | Sudan | 17.0 /100 | #208 | Poor 95.8% |
| Dutch West Indians | 16.1 /100 | #209 | Poor 95.8% |
| Hawaiians | 16.0 /100 | #210 | Poor 95.8% |
| Portuguese | 13.6 /100 | #211 | Poor 95.8% |
| Immigrants | Lebanon | 13.0 /100 | #212 | Poor 95.8% |
| Immigrants | Morocco | 12.6 /100 | #213 | Poor 95.8% |
| Bahamians | 11.6 /100 | #214 | Poor 95.7% |
| Spanish Americans | 9.3 /100 | #215 | Tragic 95.7% |
| Immigrants | Chile | 9.1 /100 | #216 | Tragic 95.7% |
| Immigrants | Pakistan | 9.0 /100 | #217 | Tragic 95.7% |
| Immigrants | Liberia | 8.1 /100 | #218 | Tragic 95.7% |
| Immigrants | Southern Europe | 7.9 /100 | #219 | Tragic 95.7% |
| Sub-Saharan Africans | 7.2 /100 | #220 | Tragic 95.7% |