Salvadoran vs Immigrants from Micronesia 7th Grade
COMPARE
Salvadoran
Immigrants from Micronesia
7th Grade
7th Grade Comparison
Salvadorans
Immigrants from Micronesia
91.5%
7TH GRADE
0.0/ 100
METRIC RATING
342nd/ 347
METRIC RANK
95.9%
7TH GRADE
32.6/ 100
METRIC RATING
190th/ 347
METRIC RANK
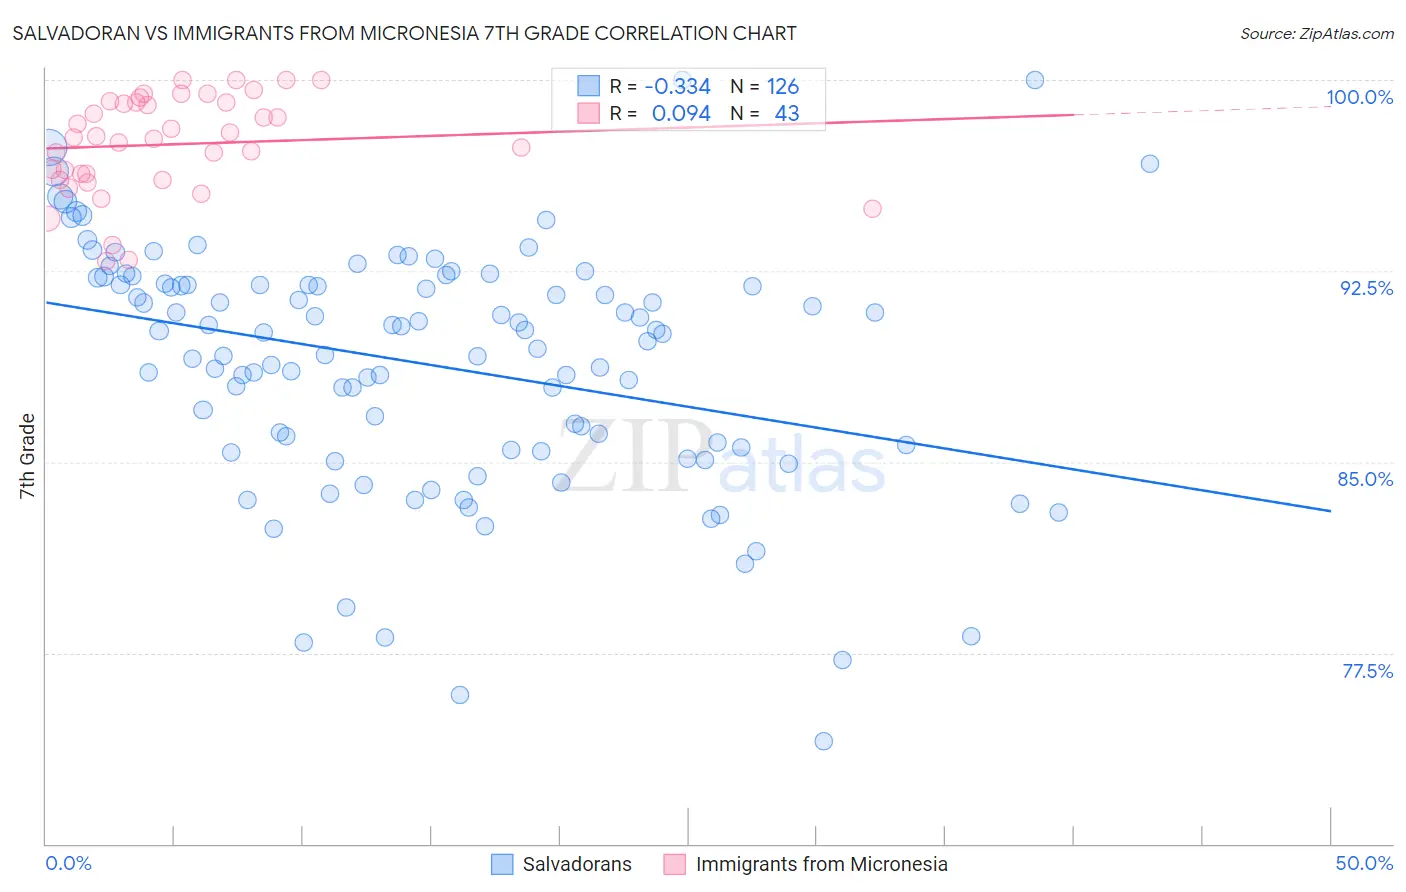
Salvadoran vs Immigrants from Micronesia 7th Grade Correlation Chart
The statistical analysis conducted on geographies consisting of 399,020,248 people shows a mild negative correlation between the proportion of Salvadorans and percentage of population with at least 7th grade education in the United States with a correlation coefficient (R) of -0.334 and weighted average of 91.5%. Similarly, the statistical analysis conducted on geographies consisting of 61,604,657 people shows a slight positive correlation between the proportion of Immigrants from Micronesia and percentage of population with at least 7th grade education in the United States with a correlation coefficient (R) of 0.094 and weighted average of 95.9%, a difference of 4.9%.
7th Grade Correlation Summary
| Measurement | Salvadoran | Immigrants from Micronesia |
| Minimum | 74.0% | 92.9% |
| Maximum | 100.0% | 100.0% |
| Range | 26.0% | 7.1% |
| Mean | 88.8% | 97.5% |
| Median | 90.1% | 97.7% |
| Interquartile 25% (IQ1) | 85.6% | 96.1% |
| Interquartile 75% (IQ3) | 92.0% | 99.1% |
| Interquartile Range (IQR) | 6.4% | 3.1% |
| Standard Deviation (Sample) | 4.8% | 1.9% |
| Standard Deviation (Population) | 4.8% | 1.9% |
Similar Demographics by 7th Grade
Demographics Similar to Salvadorans by 7th Grade
In terms of 7th grade, the demographic groups most similar to Salvadorans are Immigrants from Guatemala (91.3%, a difference of 0.16%), Guatemalan (91.7%, a difference of 0.27%), Yakama (91.7%, a difference of 0.29%), Mexican (91.9%, a difference of 0.49%), and Immigrants from Central America (91.0%, a difference of 0.52%).
| Demographics | Rating | Rank | 7th Grade |
| Immigrants | Armenia | 0.0 /100 | #333 | Tragic 92.7% |
| Immigrants | Yemen | 0.0 /100 | #334 | Tragic 92.6% |
| Mexican American Indians | 0.0 /100 | #335 | Tragic 92.6% |
| Immigrants | Honduras | 0.0 /100 | #336 | Tragic 92.5% |
| Immigrants | Latin America | 0.0 /100 | #337 | Tragic 92.2% |
| Central Americans | 0.0 /100 | #338 | Tragic 92.1% |
| Mexicans | 0.0 /100 | #339 | Tragic 91.9% |
| Yakama | 0.0 /100 | #340 | Tragic 91.7% |
| Guatemalans | 0.0 /100 | #341 | Tragic 91.7% |
| Salvadorans | 0.0 /100 | #342 | Tragic 91.5% |
| Immigrants | Guatemala | 0.0 /100 | #343 | Tragic 91.3% |
| Immigrants | Central America | 0.0 /100 | #344 | Tragic 91.0% |
| Immigrants | El Salvador | 0.0 /100 | #345 | Tragic 90.9% |
| Immigrants | Mexico | 0.0 /100 | #346 | Tragic 90.7% |
| Spanish American Indians | 0.0 /100 | #347 | Tragic 90.3% |
Demographics Similar to Immigrants from Micronesia by 7th Grade
In terms of 7th grade, the demographic groups most similar to Immigrants from Micronesia are Liberian (95.9%, a difference of 0.0%), Panamanian (95.9%, a difference of 0.0%), Immigrants from Egypt (95.9%, a difference of 0.010%), Immigrants from Venezuela (95.9%, a difference of 0.010%), and Immigrants from Bahamas (95.9%, a difference of 0.010%).
| Demographics | Rating | Rank | 7th Grade |
| Immigrants | Spain | 38.8 /100 | #183 | Fair 96.0% |
| Sierra Leoneans | 37.5 /100 | #184 | Fair 96.0% |
| Brazilians | 37.3 /100 | #185 | Fair 96.0% |
| Immigrants | Iraq | 36.1 /100 | #186 | Fair 96.0% |
| Immigrants | Uganda | 36.0 /100 | #187 | Fair 96.0% |
| Immigrants | Egypt | 34.3 /100 | #188 | Fair 95.9% |
| Immigrants | Venezuela | 33.9 /100 | #189 | Fair 95.9% |
| Immigrants | Micronesia | 32.6 /100 | #190 | Fair 95.9% |
| Liberians | 32.5 /100 | #191 | Fair 95.9% |
| Panamanians | 32.3 /100 | #192 | Fair 95.9% |
| Immigrants | Bahamas | 30.8 /100 | #193 | Fair 95.9% |
| Immigrants | Nepal | 30.0 /100 | #194 | Fair 95.9% |
| Sudanese | 28.1 /100 | #195 | Fair 95.9% |
| Apache | 27.6 /100 | #196 | Fair 95.9% |
| Immigrants | Zaire | 26.7 /100 | #197 | Fair 95.9% |