Salvadoran vs Immigrants from Uzbekistan 7th Grade
COMPARE
Salvadoran
Immigrants from Uzbekistan
7th Grade
7th Grade Comparison
Salvadorans
Immigrants from Uzbekistan
91.5%
7TH GRADE
0.0/ 100
METRIC RATING
342nd/ 347
METRIC RANK
95.1%
7TH GRADE
0.2/ 100
METRIC RATING
273rd/ 347
METRIC RANK
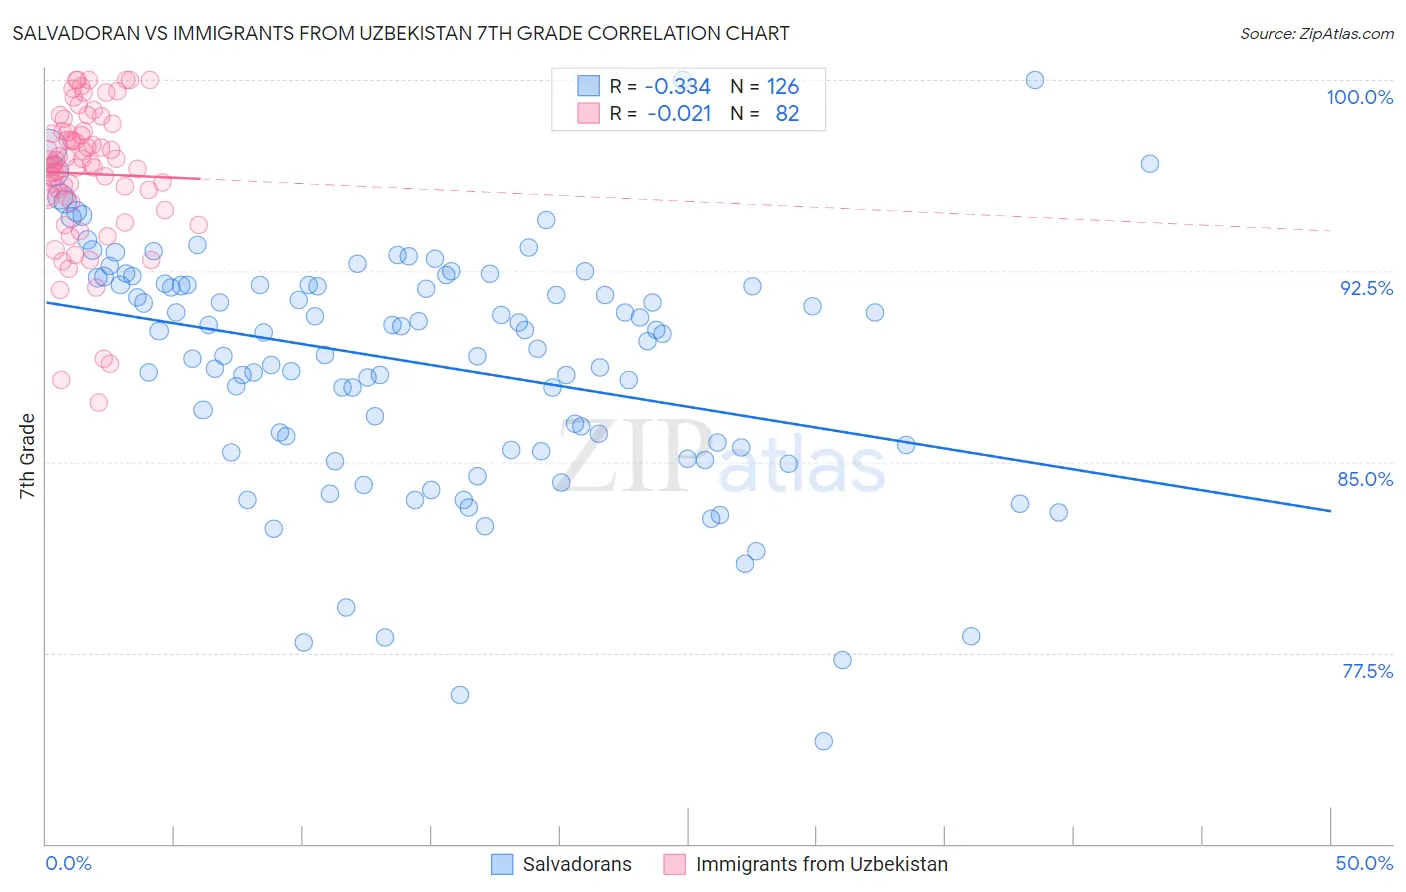
Salvadoran vs Immigrants from Uzbekistan 7th Grade Correlation Chart
The statistical analysis conducted on geographies consisting of 399,020,248 people shows a mild negative correlation between the proportion of Salvadorans and percentage of population with at least 7th grade education in the United States with a correlation coefficient (R) of -0.334 and weighted average of 91.5%. Similarly, the statistical analysis conducted on geographies consisting of 118,674,509 people shows no correlation between the proportion of Immigrants from Uzbekistan and percentage of population with at least 7th grade education in the United States with a correlation coefficient (R) of -0.021 and weighted average of 95.1%, a difference of 4.0%.
7th Grade Correlation Summary
| Measurement | Salvadoran | Immigrants from Uzbekistan |
| Minimum | 74.0% | 87.3% |
| Maximum | 100.0% | 100.0% |
| Range | 26.0% | 12.7% |
| Mean | 88.8% | 96.3% |
| Median | 90.1% | 96.7% |
| Interquartile 25% (IQ1) | 85.6% | 95.4% |
| Interquartile 75% (IQ3) | 92.0% | 98.0% |
| Interquartile Range (IQR) | 6.4% | 2.6% |
| Standard Deviation (Sample) | 4.8% | 2.7% |
| Standard Deviation (Population) | 4.8% | 2.7% |
Similar Demographics by 7th Grade
Demographics Similar to Salvadorans by 7th Grade
In terms of 7th grade, the demographic groups most similar to Salvadorans are Immigrants from Guatemala (91.3%, a difference of 0.16%), Guatemalan (91.7%, a difference of 0.27%), Yakama (91.7%, a difference of 0.29%), Mexican (91.9%, a difference of 0.49%), and Immigrants from Central America (91.0%, a difference of 0.52%).
| Demographics | Rating | Rank | 7th Grade |
| Immigrants | Armenia | 0.0 /100 | #333 | Tragic 92.7% |
| Immigrants | Yemen | 0.0 /100 | #334 | Tragic 92.6% |
| Mexican American Indians | 0.0 /100 | #335 | Tragic 92.6% |
| Immigrants | Honduras | 0.0 /100 | #336 | Tragic 92.5% |
| Immigrants | Latin America | 0.0 /100 | #337 | Tragic 92.2% |
| Central Americans | 0.0 /100 | #338 | Tragic 92.1% |
| Mexicans | 0.0 /100 | #339 | Tragic 91.9% |
| Yakama | 0.0 /100 | #340 | Tragic 91.7% |
| Guatemalans | 0.0 /100 | #341 | Tragic 91.7% |
| Salvadorans | 0.0 /100 | #342 | Tragic 91.5% |
| Immigrants | Guatemala | 0.0 /100 | #343 | Tragic 91.3% |
| Immigrants | Central America | 0.0 /100 | #344 | Tragic 91.0% |
| Immigrants | El Salvador | 0.0 /100 | #345 | Tragic 90.9% |
| Immigrants | Mexico | 0.0 /100 | #346 | Tragic 90.7% |
| Spanish American Indians | 0.0 /100 | #347 | Tragic 90.3% |
Demographics Similar to Immigrants from Uzbekistan by 7th Grade
In terms of 7th grade, the demographic groups most similar to Immigrants from Uzbekistan are Immigrants from South America (95.1%, a difference of 0.0%), Peruvian (95.1%, a difference of 0.0%), Immigrants from Western Africa (95.1%, a difference of 0.0%), Houma (95.1%, a difference of 0.010%), and Immigrants from Colombia (95.1%, a difference of 0.010%).
| Demographics | Rating | Rank | 7th Grade |
| Immigrants | Ghana | 0.3 /100 | #266 | Tragic 95.2% |
| Yuman | 0.3 /100 | #267 | Tragic 95.2% |
| Immigrants | Hong Kong | 0.3 /100 | #268 | Tragic 95.2% |
| Trinidadians and Tobagonians | 0.3 /100 | #269 | Tragic 95.2% |
| Houma | 0.2 /100 | #270 | Tragic 95.1% |
| Immigrants | South America | 0.2 /100 | #271 | Tragic 95.1% |
| Peruvians | 0.2 /100 | #272 | Tragic 95.1% |
| Immigrants | Uzbekistan | 0.2 /100 | #273 | Tragic 95.1% |
| Immigrants | Western Africa | 0.2 /100 | #274 | Tragic 95.1% |
| Immigrants | Colombia | 0.2 /100 | #275 | Tragic 95.1% |
| Immigrants | Thailand | 0.2 /100 | #276 | Tragic 95.1% |
| Immigrants | Afghanistan | 0.2 /100 | #277 | Tragic 95.1% |
| Immigrants | Trinidad and Tobago | 0.1 /100 | #278 | Tragic 95.1% |
| Barbadians | 0.1 /100 | #279 | Tragic 95.1% |
| Immigrants | St. Vincent and the Grenadines | 0.1 /100 | #280 | Tragic 95.0% |