Chinese vs Immigrants from Morocco 7th Grade
COMPARE
Chinese
Immigrants from Morocco
7th Grade
7th Grade Comparison
Chinese
Immigrants from Morocco
97.1%
7TH GRADE
99.9/ 100
METRIC RATING
42nd/ 347
METRIC RANK
95.8%
7TH GRADE
12.6/ 100
METRIC RATING
213th/ 347
METRIC RANK
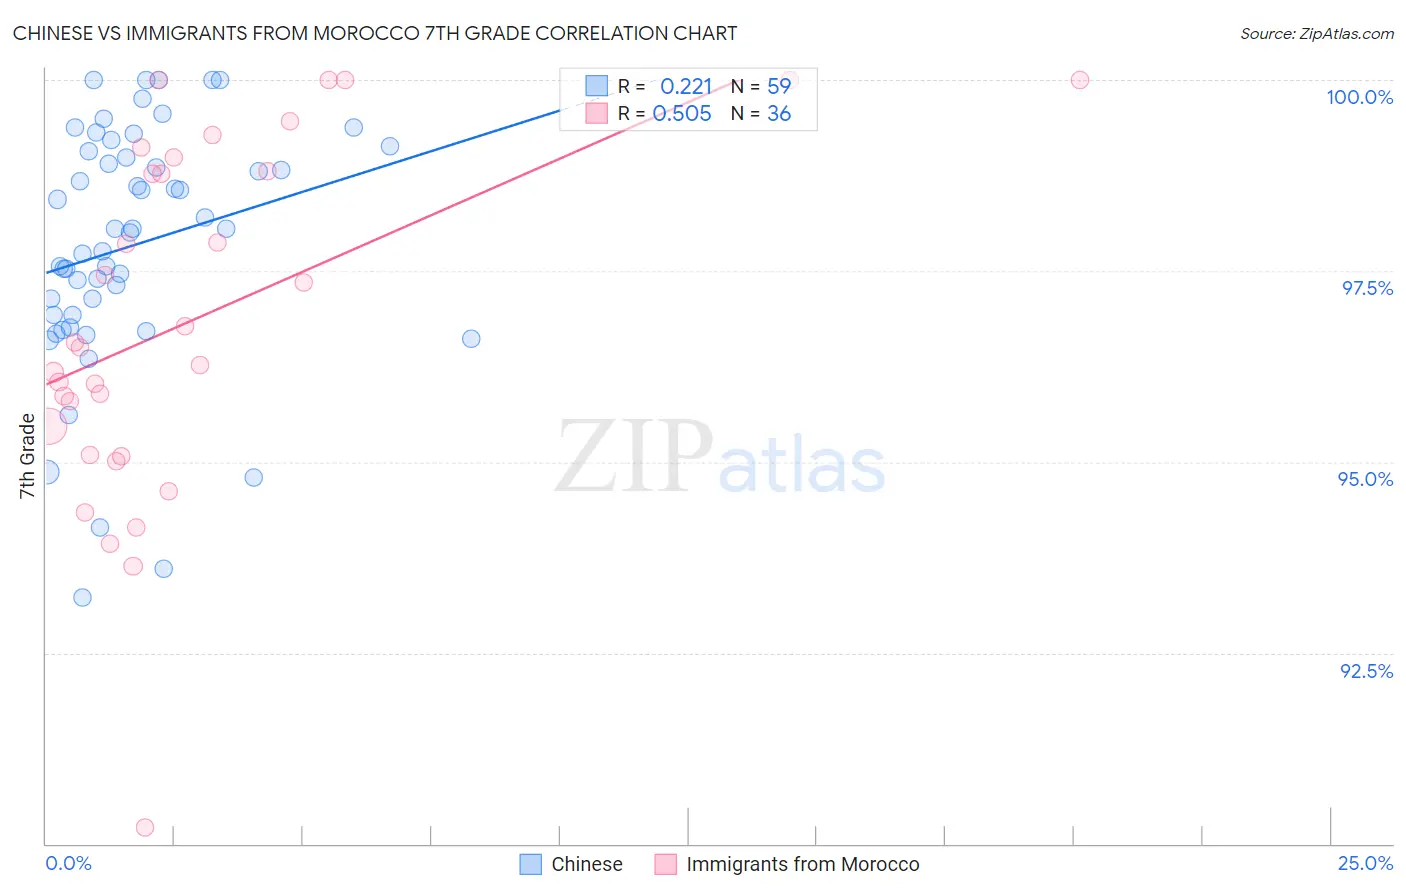
Chinese vs Immigrants from Morocco 7th Grade Correlation Chart
The statistical analysis conducted on geographies consisting of 64,809,883 people shows a weak positive correlation between the proportion of Chinese and percentage of population with at least 7th grade education in the United States with a correlation coefficient (R) of 0.221 and weighted average of 97.1%. Similarly, the statistical analysis conducted on geographies consisting of 178,910,634 people shows a substantial positive correlation between the proportion of Immigrants from Morocco and percentage of population with at least 7th grade education in the United States with a correlation coefficient (R) of 0.505 and weighted average of 95.8%, a difference of 1.5%.
7th Grade Correlation Summary
| Measurement | Chinese | Immigrants from Morocco |
| Minimum | 93.2% | 90.2% |
| Maximum | 100.0% | 100.0% |
| Range | 6.8% | 9.8% |
| Mean | 97.8% | 96.9% |
| Median | 98.0% | 96.5% |
| Interquartile 25% (IQ1) | 96.9% | 95.3% |
| Interquartile 75% (IQ3) | 99.1% | 98.9% |
| Interquartile Range (IQR) | 2.2% | 3.6% |
| Standard Deviation (Sample) | 1.6% | 2.3% |
| Standard Deviation (Population) | 1.6% | 2.3% |
Similar Demographics by 7th Grade
Demographics Similar to Chinese by 7th Grade
In terms of 7th grade, the demographic groups most similar to Chinese are Maltese (97.1%, a difference of 0.030%), Eastern European (97.2%, a difference of 0.040%), Northern European (97.1%, a difference of 0.040%), Czechoslovakian (97.1%, a difference of 0.040%), and Aleut (97.1%, a difference of 0.050%).
| Demographics | Rating | Rank | 7th Grade |
| Swiss | 100.0 /100 | #35 | Exceptional 97.3% |
| Hungarians | 100.0 /100 | #36 | Exceptional 97.2% |
| British | 100.0 /100 | #37 | Exceptional 97.2% |
| Belgians | 100.0 /100 | #38 | Exceptional 97.2% |
| Latvians | 100.0 /100 | #39 | Exceptional 97.2% |
| Luxembourgers | 100.0 /100 | #40 | Exceptional 97.2% |
| Eastern Europeans | 100.0 /100 | #41 | Exceptional 97.2% |
| Chinese | 99.9 /100 | #42 | Exceptional 97.1% |
| Maltese | 99.9 /100 | #43 | Exceptional 97.1% |
| Northern Europeans | 99.9 /100 | #44 | Exceptional 97.1% |
| Czechoslovakians | 99.9 /100 | #45 | Exceptional 97.1% |
| Aleuts | 99.9 /100 | #46 | Exceptional 97.1% |
| Bulgarians | 99.9 /100 | #47 | Exceptional 97.1% |
| Celtics | 99.9 /100 | #48 | Exceptional 97.1% |
| Slavs | 99.9 /100 | #49 | Exceptional 97.1% |
Demographics Similar to Immigrants from Morocco by 7th Grade
In terms of 7th grade, the demographic groups most similar to Immigrants from Morocco are Immigrants from Lebanon (95.8%, a difference of 0.0%), Portuguese (95.8%, a difference of 0.010%), Bahamian (95.7%, a difference of 0.010%), Dutch West Indian (95.8%, a difference of 0.040%), and Hawaiian (95.8%, a difference of 0.040%).
| Demographics | Rating | Rank | 7th Grade |
| Africans | 17.6 /100 | #206 | Poor 95.8% |
| Navajo | 17.0 /100 | #207 | Poor 95.8% |
| Immigrants | Sudan | 17.0 /100 | #208 | Poor 95.8% |
| Dutch West Indians | 16.1 /100 | #209 | Poor 95.8% |
| Hawaiians | 16.0 /100 | #210 | Poor 95.8% |
| Portuguese | 13.6 /100 | #211 | Poor 95.8% |
| Immigrants | Lebanon | 13.0 /100 | #212 | Poor 95.8% |
| Immigrants | Morocco | 12.6 /100 | #213 | Poor 95.8% |
| Bahamians | 11.6 /100 | #214 | Poor 95.7% |
| Spanish Americans | 9.3 /100 | #215 | Tragic 95.7% |
| Immigrants | Chile | 9.1 /100 | #216 | Tragic 95.7% |
| Immigrants | Pakistan | 9.0 /100 | #217 | Tragic 95.7% |
| Immigrants | Liberia | 8.1 /100 | #218 | Tragic 95.7% |
| Immigrants | Southern Europe | 7.9 /100 | #219 | Tragic 95.7% |
| Sub-Saharan Africans | 7.2 /100 | #220 | Tragic 95.7% |