Russian vs Sierra Leonean Doctorate Degree
COMPARE
Russian
Sierra Leonean
Doctorate Degree
Doctorate Degree Comparison
Russians
Sierra Leoneans
2.6%
DOCTORATE DEGREE
100.0/ 100
METRIC RATING
38th/ 347
METRIC RANK
2.0%
DOCTORATE DEGREE
85.1/ 100
METRIC RATING
143rd/ 347
METRIC RANK
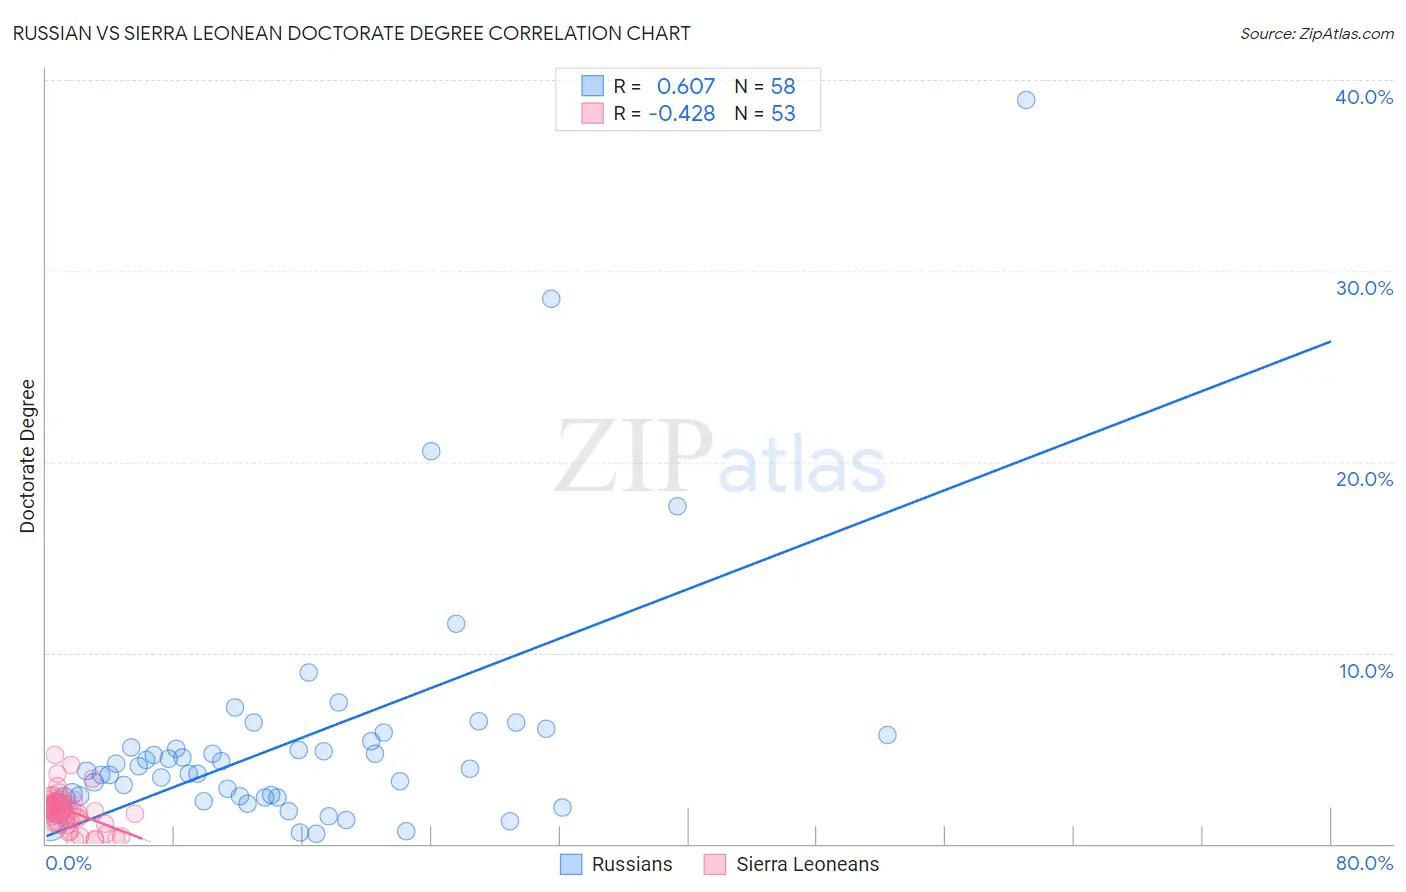
Russian vs Sierra Leonean Doctorate Degree Correlation Chart
The statistical analysis conducted on geographies consisting of 501,018,326 people shows a significant positive correlation between the proportion of Russians and percentage of population with at least doctorate degree education in the United States with a correlation coefficient (R) of 0.607 and weighted average of 2.6%. Similarly, the statistical analysis conducted on geographies consisting of 83,237,718 people shows a moderate negative correlation between the proportion of Sierra Leoneans and percentage of population with at least doctorate degree education in the United States with a correlation coefficient (R) of -0.428 and weighted average of 2.0%, a difference of 30.4%.
Doctorate Degree Correlation Summary
| Measurement | Russian | Sierra Leonean |
| Minimum | 0.50% | 0.21% |
| Maximum | 39.0% | 4.7% |
| Range | 38.5% | 4.5% |
| Mean | 5.4% | 1.7% |
| Median | 3.9% | 1.7% |
| Interquartile 25% (IQ1) | 2.4% | 1.1% |
| Interquartile 75% (IQ3) | 5.4% | 2.2% |
| Interquartile Range (IQR) | 2.9% | 1.0% |
| Standard Deviation (Sample) | 6.5% | 0.95% |
| Standard Deviation (Population) | 6.4% | 0.94% |
Similar Demographics by Doctorate Degree
Demographics Similar to Russians by Doctorate Degree
In terms of doctorate degree, the demographic groups most similar to Russians are Immigrants from Kuwait (2.6%, a difference of 0.15%), Immigrants from Spain (2.6%, a difference of 0.42%), Immigrants from Malaysia (2.6%, a difference of 0.48%), Immigrants from Ireland (2.5%, a difference of 0.49%), and Cypriot (2.6%, a difference of 0.53%).
| Demographics | Rating | Rank | Doctorate Degree |
| Latvians | 100.0 /100 | #31 | Exceptional 2.6% |
| Immigrants | Northern Europe | 100.0 /100 | #32 | Exceptional 2.6% |
| Cambodians | 100.0 /100 | #33 | Exceptional 2.6% |
| Cypriots | 100.0 /100 | #34 | Exceptional 2.6% |
| Immigrants | Malaysia | 100.0 /100 | #35 | Exceptional 2.6% |
| Immigrants | Spain | 100.0 /100 | #36 | Exceptional 2.6% |
| Immigrants | Kuwait | 100.0 /100 | #37 | Exceptional 2.6% |
| Russians | 100.0 /100 | #38 | Exceptional 2.6% |
| Immigrants | Ireland | 100.0 /100 | #39 | Exceptional 2.5% |
| Estonians | 100.0 /100 | #40 | Exceptional 2.5% |
| Immigrants | Russia | 100.0 /100 | #41 | Exceptional 2.5% |
| New Zealanders | 100.0 /100 | #42 | Exceptional 2.5% |
| Soviet Union | 100.0 /100 | #43 | Exceptional 2.5% |
| Immigrants | Netherlands | 100.0 /100 | #44 | Exceptional 2.5% |
| Immigrants | South Africa | 100.0 /100 | #45 | Exceptional 2.4% |
Demographics Similar to Sierra Leoneans by Doctorate Degree
In terms of doctorate degree, the demographic groups most similar to Sierra Leoneans are Immigrants from Moldova (2.0%, a difference of 0.21%), Italian (2.0%, a difference of 0.25%), Kenyan (1.9%, a difference of 0.39%), Immigrants from Syria (1.9%, a difference of 0.41%), and Senegalese (2.0%, a difference of 0.46%).
| Demographics | Rating | Rank | Doctorate Degree |
| Swedes | 88.3 /100 | #136 | Excellent 2.0% |
| South American Indians | 88.3 /100 | #137 | Excellent 2.0% |
| Swiss | 88.0 /100 | #138 | Excellent 2.0% |
| Afghans | 87.2 /100 | #139 | Excellent 2.0% |
| Immigrants | Africa | 87.0 /100 | #140 | Excellent 2.0% |
| Senegalese | 86.7 /100 | #141 | Excellent 2.0% |
| Italians | 86.0 /100 | #142 | Excellent 2.0% |
| Sierra Leoneans | 85.1 /100 | #143 | Excellent 2.0% |
| Immigrants | Moldova | 84.3 /100 | #144 | Excellent 2.0% |
| Kenyans | 83.6 /100 | #145 | Excellent 1.9% |
| Immigrants | Syria | 83.6 /100 | #146 | Excellent 1.9% |
| Immigrants | Senegal | 82.5 /100 | #147 | Excellent 1.9% |
| Luxembourgers | 81.1 /100 | #148 | Excellent 1.9% |
| Basques | 76.9 /100 | #149 | Good 1.9% |
| English | 75.9 /100 | #150 | Good 1.9% |