Russian vs Immigrants from Congo Doctorate Degree
COMPARE
Russian
Immigrants from Congo
Doctorate Degree
Doctorate Degree Comparison
Russians
Immigrants from Congo
2.6%
DOCTORATE DEGREE
100.0/ 100
METRIC RATING
38th/ 347
METRIC RANK
1.6%
DOCTORATE DEGREE
2.6/ 100
METRIC RATING
238th/ 347
METRIC RANK
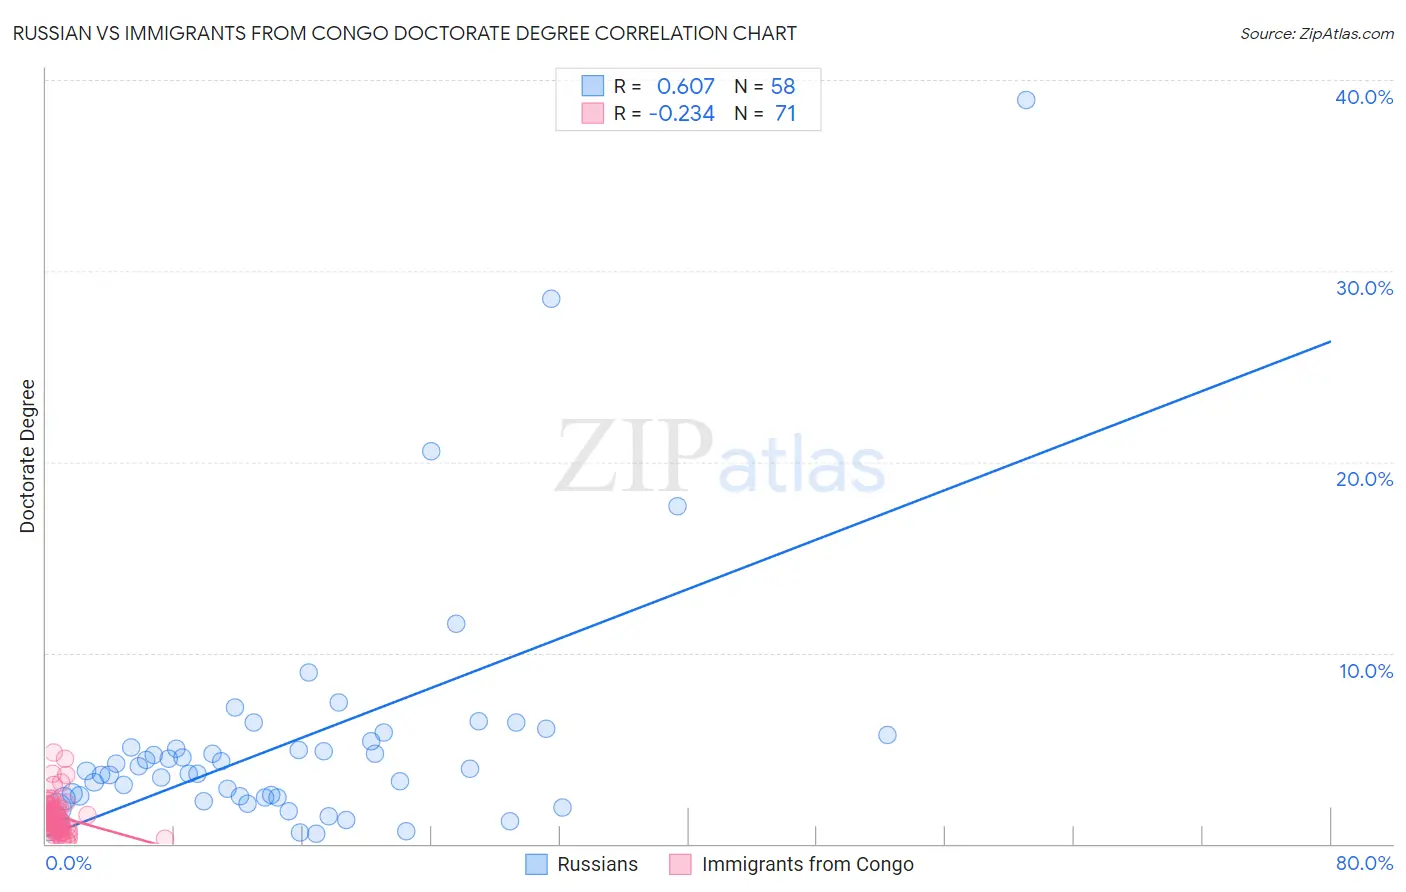
Russian vs Immigrants from Congo Doctorate Degree Correlation Chart
The statistical analysis conducted on geographies consisting of 501,018,326 people shows a significant positive correlation between the proportion of Russians and percentage of population with at least doctorate degree education in the United States with a correlation coefficient (R) of 0.607 and weighted average of 2.6%. Similarly, the statistical analysis conducted on geographies consisting of 91,930,885 people shows a weak negative correlation between the proportion of Immigrants from Congo and percentage of population with at least doctorate degree education in the United States with a correlation coefficient (R) of -0.234 and weighted average of 1.6%, a difference of 60.1%.
Doctorate Degree Correlation Summary
| Measurement | Russian | Immigrants from Congo |
| Minimum | 0.50% | 0.075% |
| Maximum | 39.0% | 4.8% |
| Range | 38.5% | 4.7% |
| Mean | 5.4% | 1.4% |
| Median | 3.9% | 1.3% |
| Interquartile 25% (IQ1) | 2.4% | 0.80% |
| Interquartile 75% (IQ3) | 5.4% | 1.8% |
| Interquartile Range (IQR) | 2.9% | 1.0% |
| Standard Deviation (Sample) | 6.5% | 0.94% |
| Standard Deviation (Population) | 6.4% | 0.93% |
Similar Demographics by Doctorate Degree
Demographics Similar to Russians by Doctorate Degree
In terms of doctorate degree, the demographic groups most similar to Russians are Immigrants from Kuwait (2.6%, a difference of 0.15%), Immigrants from Spain (2.6%, a difference of 0.42%), Immigrants from Malaysia (2.6%, a difference of 0.48%), Immigrants from Ireland (2.5%, a difference of 0.49%), and Cypriot (2.6%, a difference of 0.53%).
| Demographics | Rating | Rank | Doctorate Degree |
| Latvians | 100.0 /100 | #31 | Exceptional 2.6% |
| Immigrants | Northern Europe | 100.0 /100 | #32 | Exceptional 2.6% |
| Cambodians | 100.0 /100 | #33 | Exceptional 2.6% |
| Cypriots | 100.0 /100 | #34 | Exceptional 2.6% |
| Immigrants | Malaysia | 100.0 /100 | #35 | Exceptional 2.6% |
| Immigrants | Spain | 100.0 /100 | #36 | Exceptional 2.6% |
| Immigrants | Kuwait | 100.0 /100 | #37 | Exceptional 2.6% |
| Russians | 100.0 /100 | #38 | Exceptional 2.6% |
| Immigrants | Ireland | 100.0 /100 | #39 | Exceptional 2.5% |
| Estonians | 100.0 /100 | #40 | Exceptional 2.5% |
| Immigrants | Russia | 100.0 /100 | #41 | Exceptional 2.5% |
| New Zealanders | 100.0 /100 | #42 | Exceptional 2.5% |
| Soviet Union | 100.0 /100 | #43 | Exceptional 2.5% |
| Immigrants | Netherlands | 100.0 /100 | #44 | Exceptional 2.5% |
| Immigrants | South Africa | 100.0 /100 | #45 | Exceptional 2.4% |
Demographics Similar to Immigrants from Congo by Doctorate Degree
In terms of doctorate degree, the demographic groups most similar to Immigrants from Congo are West Indian (1.6%, a difference of 0.10%), Iroquois (1.6%, a difference of 0.20%), Immigrants from Panama (1.6%, a difference of 0.29%), Indonesian (1.6%, a difference of 0.39%), and Cheyenne (1.6%, a difference of 0.48%).
| Demographics | Rating | Rank | Doctorate Degree |
| Immigrants | North Macedonia | 3.9 /100 | #231 | Tragic 1.6% |
| Guamanians/Chamorros | 3.3 /100 | #232 | Tragic 1.6% |
| Barbadians | 3.3 /100 | #233 | Tragic 1.6% |
| Hopi | 3.2 /100 | #234 | Tragic 1.6% |
| Cree | 3.0 /100 | #235 | Tragic 1.6% |
| Indonesians | 2.8 /100 | #236 | Tragic 1.6% |
| Iroquois | 2.7 /100 | #237 | Tragic 1.6% |
| Immigrants | Congo | 2.6 /100 | #238 | Tragic 1.6% |
| West Indians | 2.5 /100 | #239 | Tragic 1.6% |
| Immigrants | Panama | 2.4 /100 | #240 | Tragic 1.6% |
| Cheyenne | 2.3 /100 | #241 | Tragic 1.6% |
| Ottawa | 2.2 /100 | #242 | Tragic 1.6% |
| Native Hawaiians | 2.1 /100 | #243 | Tragic 1.6% |
| French American Indians | 2.0 /100 | #244 | Tragic 1.6% |
| Delaware | 1.9 /100 | #245 | Tragic 1.6% |