Finnish vs Cheyenne Associate's Degree
COMPARE
Finnish
Cheyenne
Associate's Degree
Associate's Degree Comparison
Finns
Cheyenne
46.3%
ASSOCIATE'S DEGREE
48.5/ 100
METRIC RATING
176th/ 347
METRIC RANK
38.7%
ASSOCIATE'S DEGREE
0.0/ 100
METRIC RATING
298th/ 347
METRIC RANK
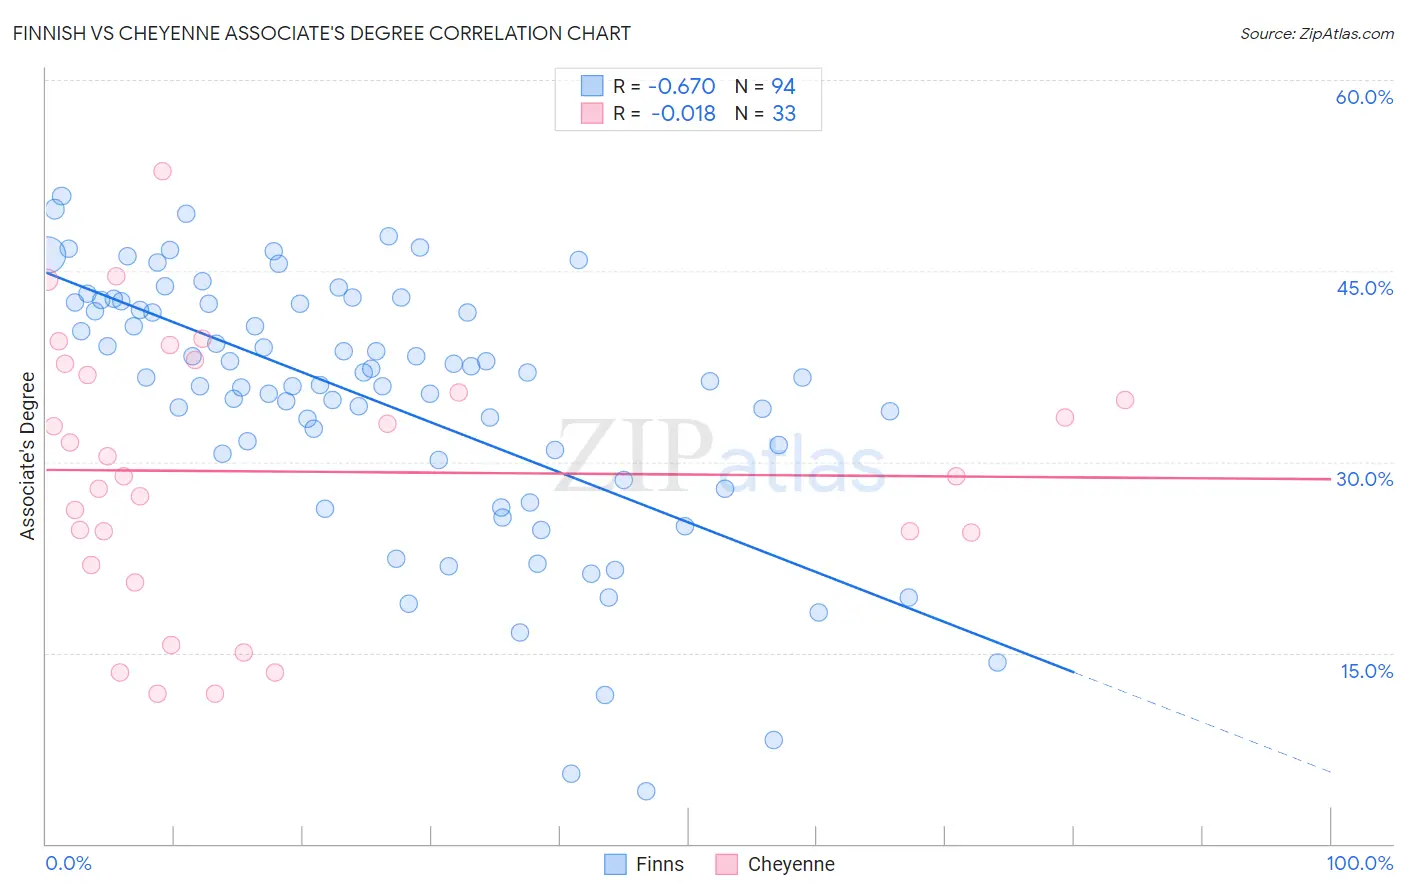
Finnish vs Cheyenne Associate's Degree Correlation Chart
The statistical analysis conducted on geographies consisting of 404,653,186 people shows a significant negative correlation between the proportion of Finns and percentage of population with at least associate's degree education in the United States with a correlation coefficient (R) of -0.670 and weighted average of 46.3%. Similarly, the statistical analysis conducted on geographies consisting of 80,719,085 people shows no correlation between the proportion of Cheyenne and percentage of population with at least associate's degree education in the United States with a correlation coefficient (R) of -0.018 and weighted average of 38.7%, a difference of 19.8%.
Associate's Degree Correlation Summary
| Measurement | Finnish | Cheyenne |
| Minimum | 4.1% | 11.8% |
| Maximum | 50.9% | 52.8% |
| Range | 46.8% | 41.1% |
| Mean | 34.7% | 29.2% |
| Median | 36.6% | 28.8% |
| Interquartile 25% (IQ1) | 30.2% | 23.2% |
| Interquartile 75% (IQ3) | 42.4% | 37.3% |
| Interquartile Range (IQR) | 12.3% | 14.1% |
| Standard Deviation (Sample) | 10.2% | 10.3% |
| Standard Deviation (Population) | 10.1% | 10.1% |
Similar Demographics by Associate's Degree
Demographics Similar to Finns by Associate's Degree
In terms of associate's degree, the demographic groups most similar to Finns are Slovak (46.3%, a difference of 0.010%), Belgian (46.3%, a difference of 0.020%), Immigrants from Bosnia and Herzegovina (46.3%, a difference of 0.020%), Sri Lankan (46.3%, a difference of 0.070%), and English (46.4%, a difference of 0.11%).
| Demographics | Rating | Rank | Associate's Degree |
| Uruguayans | 55.4 /100 | #169 | Average 46.5% |
| Irish | 53.6 /100 | #170 | Average 46.5% |
| Basques | 52.8 /100 | #171 | Average 46.5% |
| Peruvians | 50.5 /100 | #172 | Average 46.4% |
| Immigrants | Iraq | 50.3 /100 | #173 | Average 46.4% |
| English | 50.0 /100 | #174 | Average 46.4% |
| Belgians | 48.9 /100 | #175 | Average 46.3% |
| Finns | 48.5 /100 | #176 | Average 46.3% |
| Slovaks | 48.4 /100 | #177 | Average 46.3% |
| Immigrants | Bosnia and Herzegovina | 48.3 /100 | #178 | Average 46.3% |
| Sri Lankans | 47.6 /100 | #179 | Average 46.3% |
| Bermudans | 46.4 /100 | #180 | Average 46.2% |
| Immigrants | Colombia | 41.3 /100 | #181 | Average 46.0% |
| Swiss | 40.4 /100 | #182 | Average 46.0% |
| Yugoslavians | 40.2 /100 | #183 | Average 46.0% |
Demographics Similar to Cheyenne by Associate's Degree
In terms of associate's degree, the demographic groups most similar to Cheyenne are Ute (38.6%, a difference of 0.090%), Chickasaw (38.6%, a difference of 0.13%), Tsimshian (38.6%, a difference of 0.19%), Cape Verdean (38.8%, a difference of 0.26%), and Colville (38.5%, a difference of 0.34%).
| Demographics | Rating | Rank | Associate's Degree |
| Dominicans | 0.0 /100 | #291 | Tragic 39.3% |
| Blacks/African Americans | 0.0 /100 | #292 | Tragic 39.1% |
| Nepalese | 0.0 /100 | #293 | Tragic 39.0% |
| Salvadorans | 0.0 /100 | #294 | Tragic 39.0% |
| Hondurans | 0.0 /100 | #295 | Tragic 38.9% |
| Cherokee | 0.0 /100 | #296 | Tragic 38.9% |
| Cape Verdeans | 0.0 /100 | #297 | Tragic 38.8% |
| Cheyenne | 0.0 /100 | #298 | Tragic 38.7% |
| Ute | 0.0 /100 | #299 | Tragic 38.6% |
| Chickasaw | 0.0 /100 | #300 | Tragic 38.6% |
| Tsimshian | 0.0 /100 | #301 | Tragic 38.6% |
| Colville | 0.0 /100 | #302 | Tragic 38.5% |
| Guatemalans | 0.0 /100 | #303 | Tragic 38.5% |
| Sioux | 0.0 /100 | #304 | Tragic 38.5% |
| Immigrants | Honduras | 0.0 /100 | #305 | Tragic 38.5% |