Romanian vs U.S. Virgin Islander 11th Grade
COMPARE
Romanian
U.S. Virgin Islander
11th Grade
11th Grade Comparison
Romanians
U.S. Virgin Islanders
93.8%
11TH GRADE
99.6/ 100
METRIC RATING
73rd/ 347
METRIC RANK
91.1%
11TH GRADE
0.2/ 100
METRIC RATING
268th/ 347
METRIC RANK
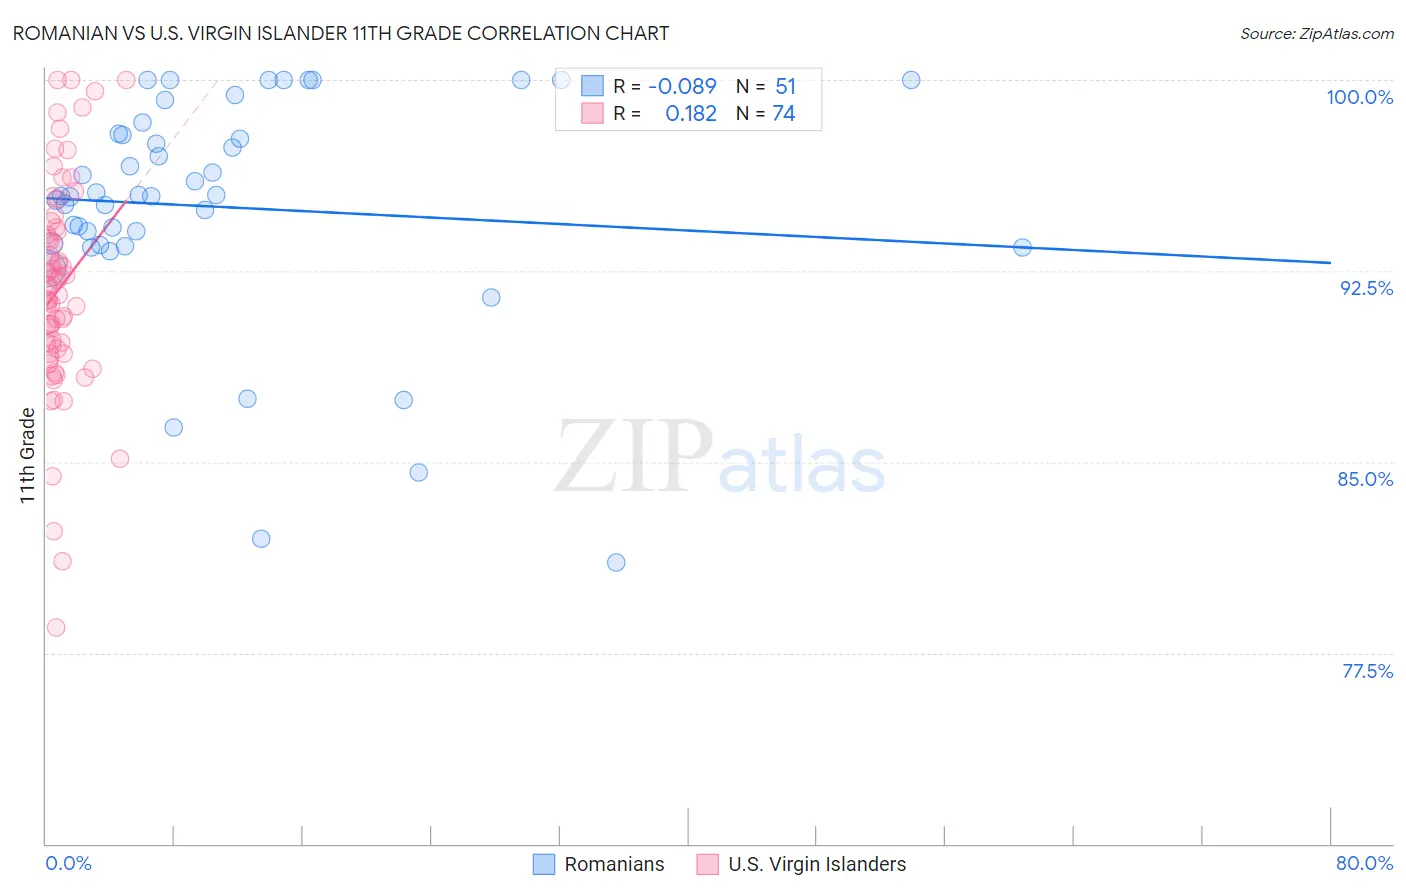
Romanian vs U.S. Virgin Islander 11th Grade Correlation Chart
The statistical analysis conducted on geographies consisting of 377,905,400 people shows a slight negative correlation between the proportion of Romanians and percentage of population with at least 11th grade education in the United States with a correlation coefficient (R) of -0.089 and weighted average of 93.8%. Similarly, the statistical analysis conducted on geographies consisting of 87,529,315 people shows a poor positive correlation between the proportion of U.S. Virgin Islanders and percentage of population with at least 11th grade education in the United States with a correlation coefficient (R) of 0.182 and weighted average of 91.1%, a difference of 2.9%.
11th Grade Correlation Summary
| Measurement | Romanian | U.S. Virgin Islander |
| Minimum | 81.0% | 78.5% |
| Maximum | 100.0% | 100.0% |
| Range | 19.0% | 21.5% |
| Mean | 95.0% | 91.8% |
| Median | 95.5% | 91.7% |
| Interquartile 25% (IQ1) | 93.5% | 89.4% |
| Interquartile 75% (IQ3) | 97.9% | 94.1% |
| Interquartile Range (IQR) | 4.3% | 4.7% |
| Standard Deviation (Sample) | 4.5% | 4.2% |
| Standard Deviation (Population) | 4.5% | 4.2% |
Similar Demographics by 11th Grade
Demographics Similar to Romanians by 11th Grade
In terms of 11th grade, the demographic groups most similar to Romanians are Immigrants from Czechoslovakia (93.8%, a difference of 0.0%), Immigrants from Japan (93.8%, a difference of 0.020%), Immigrants from Latvia (93.8%, a difference of 0.020%), Immigrants from South Africa (93.8%, a difference of 0.050%), and Celtic (93.7%, a difference of 0.050%).
| Demographics | Rating | Rank | 11th Grade |
| Alaskan Athabascans | 99.8 /100 | #66 | Exceptional 93.9% |
| Immigrants | Netherlands | 99.8 /100 | #67 | Exceptional 93.9% |
| Zimbabweans | 99.8 /100 | #68 | Exceptional 93.9% |
| Scotch-Irish | 99.8 /100 | #69 | Exceptional 93.9% |
| Immigrants | England | 99.7 /100 | #70 | Exceptional 93.8% |
| Immigrants | South Africa | 99.7 /100 | #71 | Exceptional 93.8% |
| Immigrants | Japan | 99.7 /100 | #72 | Exceptional 93.8% |
| Romanians | 99.6 /100 | #73 | Exceptional 93.8% |
| Immigrants | Czechoslovakia | 99.6 /100 | #74 | Exceptional 93.8% |
| Immigrants | Latvia | 99.6 /100 | #75 | Exceptional 93.8% |
| Celtics | 99.5 /100 | #76 | Exceptional 93.7% |
| Aleuts | 99.5 /100 | #77 | Exceptional 93.7% |
| Soviet Union | 99.5 /100 | #78 | Exceptional 93.7% |
| Immigrants | Denmark | 99.5 /100 | #79 | Exceptional 93.7% |
| Canadians | 99.5 /100 | #80 | Exceptional 93.7% |
Demographics Similar to U.S. Virgin Islanders by 11th Grade
In terms of 11th grade, the demographic groups most similar to U.S. Virgin Islanders are Ute (91.1%, a difference of 0.030%), Trinidadian and Tobagonian (91.1%, a difference of 0.060%), Immigrants from Jamaica (91.2%, a difference of 0.070%), Immigrants from Western Africa (91.2%, a difference of 0.080%), and Immigrants from Peru (91.0%, a difference of 0.090%).
| Demographics | Rating | Rank | 11th Grade |
| Taiwanese | 0.6 /100 | #261 | Tragic 91.3% |
| Immigrants | Uruguay | 0.5 /100 | #262 | Tragic 91.3% |
| Immigrants | Ghana | 0.3 /100 | #263 | Tragic 91.2% |
| Yup'ik | 0.3 /100 | #264 | Tragic 91.2% |
| Pueblo | 0.3 /100 | #265 | Tragic 91.2% |
| Immigrants | Western Africa | 0.3 /100 | #266 | Tragic 91.2% |
| Immigrants | Jamaica | 0.3 /100 | #267 | Tragic 91.2% |
| U.S. Virgin Islanders | 0.2 /100 | #268 | Tragic 91.1% |
| Ute | 0.2 /100 | #269 | Tragic 91.1% |
| Trinidadians and Tobagonians | 0.2 /100 | #270 | Tragic 91.1% |
| Immigrants | Peru | 0.1 /100 | #271 | Tragic 91.0% |
| West Indians | 0.1 /100 | #272 | Tragic 91.0% |
| Paiute | 0.1 /100 | #273 | Tragic 91.0% |
| Immigrants | Trinidad and Tobago | 0.1 /100 | #274 | Tragic 90.9% |
| Immigrants | South Eastern Asia | 0.1 /100 | #275 | Tragic 90.9% |