Romanian vs Immigrants from Thailand 11th Grade
COMPARE
Romanian
Immigrants from Thailand
11th Grade
11th Grade Comparison
Romanians
Immigrants from Thailand
93.8%
11TH GRADE
99.6/ 100
METRIC RATING
73rd/ 347
METRIC RANK
91.6%
11TH GRADE
1.4/ 100
METRIC RATING
243rd/ 347
METRIC RANK
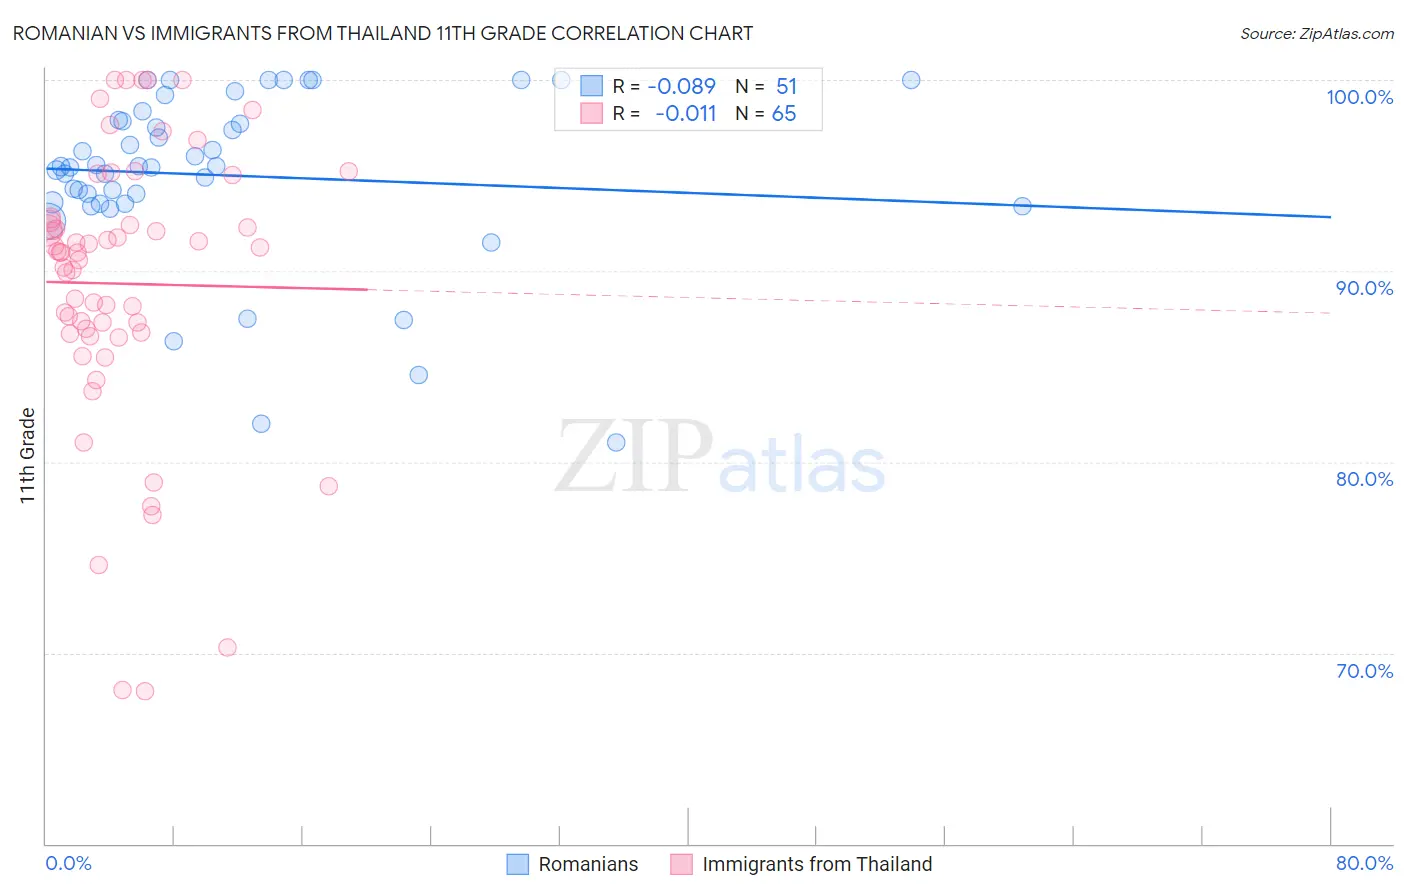
Romanian vs Immigrants from Thailand 11th Grade Correlation Chart
The statistical analysis conducted on geographies consisting of 377,905,400 people shows a slight negative correlation between the proportion of Romanians and percentage of population with at least 11th grade education in the United States with a correlation coefficient (R) of -0.089 and weighted average of 93.8%. Similarly, the statistical analysis conducted on geographies consisting of 317,023,903 people shows no correlation between the proportion of Immigrants from Thailand and percentage of population with at least 11th grade education in the United States with a correlation coefficient (R) of -0.011 and weighted average of 91.6%, a difference of 2.4%.
11th Grade Correlation Summary
| Measurement | Romanian | Immigrants from Thailand |
| Minimum | 81.0% | 68.0% |
| Maximum | 100.0% | 100.0% |
| Range | 19.0% | 32.0% |
| Mean | 95.0% | 89.3% |
| Median | 95.5% | 91.0% |
| Interquartile 25% (IQ1) | 93.5% | 86.8% |
| Interquartile 75% (IQ3) | 97.9% | 92.7% |
| Interquartile Range (IQR) | 4.3% | 5.9% |
| Standard Deviation (Sample) | 4.5% | 7.3% |
| Standard Deviation (Population) | 4.5% | 7.3% |
Similar Demographics by 11th Grade
Demographics Similar to Romanians by 11th Grade
In terms of 11th grade, the demographic groups most similar to Romanians are Immigrants from Czechoslovakia (93.8%, a difference of 0.0%), Immigrants from Japan (93.8%, a difference of 0.020%), Immigrants from Latvia (93.8%, a difference of 0.020%), Immigrants from South Africa (93.8%, a difference of 0.050%), and Celtic (93.7%, a difference of 0.050%).
| Demographics | Rating | Rank | 11th Grade |
| Alaskan Athabascans | 99.8 /100 | #66 | Exceptional 93.9% |
| Immigrants | Netherlands | 99.8 /100 | #67 | Exceptional 93.9% |
| Zimbabweans | 99.8 /100 | #68 | Exceptional 93.9% |
| Scotch-Irish | 99.8 /100 | #69 | Exceptional 93.9% |
| Immigrants | England | 99.7 /100 | #70 | Exceptional 93.8% |
| Immigrants | South Africa | 99.7 /100 | #71 | Exceptional 93.8% |
| Immigrants | Japan | 99.7 /100 | #72 | Exceptional 93.8% |
| Romanians | 99.6 /100 | #73 | Exceptional 93.8% |
| Immigrants | Czechoslovakia | 99.6 /100 | #74 | Exceptional 93.8% |
| Immigrants | Latvia | 99.6 /100 | #75 | Exceptional 93.8% |
| Celtics | 99.5 /100 | #76 | Exceptional 93.7% |
| Aleuts | 99.5 /100 | #77 | Exceptional 93.7% |
| Soviet Union | 99.5 /100 | #78 | Exceptional 93.7% |
| Immigrants | Denmark | 99.5 /100 | #79 | Exceptional 93.7% |
| Canadians | 99.5 /100 | #80 | Exceptional 93.7% |
Demographics Similar to Immigrants from Thailand by 11th Grade
In terms of 11th grade, the demographic groups most similar to Immigrants from Thailand are Senegalese (91.6%, a difference of 0.010%), African (91.5%, a difference of 0.020%), Immigrants from Middle Africa (91.6%, a difference of 0.030%), Seminole (91.5%, a difference of 0.050%), and Bahamian (91.6%, a difference of 0.060%).
| Demographics | Rating | Rank | 11th Grade |
| Colombians | 2.8 /100 | #236 | Tragic 91.7% |
| Immigrants | Bolivia | 2.8 /100 | #237 | Tragic 91.7% |
| Comanche | 2.6 /100 | #238 | Tragic 91.7% |
| Hopi | 2.5 /100 | #239 | Tragic 91.7% |
| South Americans | 2.0 /100 | #240 | Tragic 91.6% |
| Bahamians | 1.8 /100 | #241 | Tragic 91.6% |
| Immigrants | Middle Africa | 1.6 /100 | #242 | Tragic 91.6% |
| Immigrants | Thailand | 1.4 /100 | #243 | Tragic 91.6% |
| Senegalese | 1.4 /100 | #244 | Tragic 91.6% |
| Africans | 1.3 /100 | #245 | Tragic 91.5% |
| Seminole | 1.2 /100 | #246 | Tragic 91.5% |
| Immigrants | Philippines | 1.0 /100 | #247 | Tragic 91.5% |
| Immigrants | Uzbekistan | 1.0 /100 | #248 | Tragic 91.5% |
| Peruvians | 1.0 /100 | #249 | Tragic 91.5% |
| Ghanaians | 0.9 /100 | #250 | Tragic 91.5% |