Greek vs U.S. Virgin Islander 11th Grade
COMPARE
Greek
U.S. Virgin Islander
11th Grade
11th Grade Comparison
Greeks
U.S. Virgin Islanders
94.1%
11TH GRADE
99.9/ 100
METRIC RATING
43rd/ 347
METRIC RANK
91.1%
11TH GRADE
0.2/ 100
METRIC RATING
268th/ 347
METRIC RANK
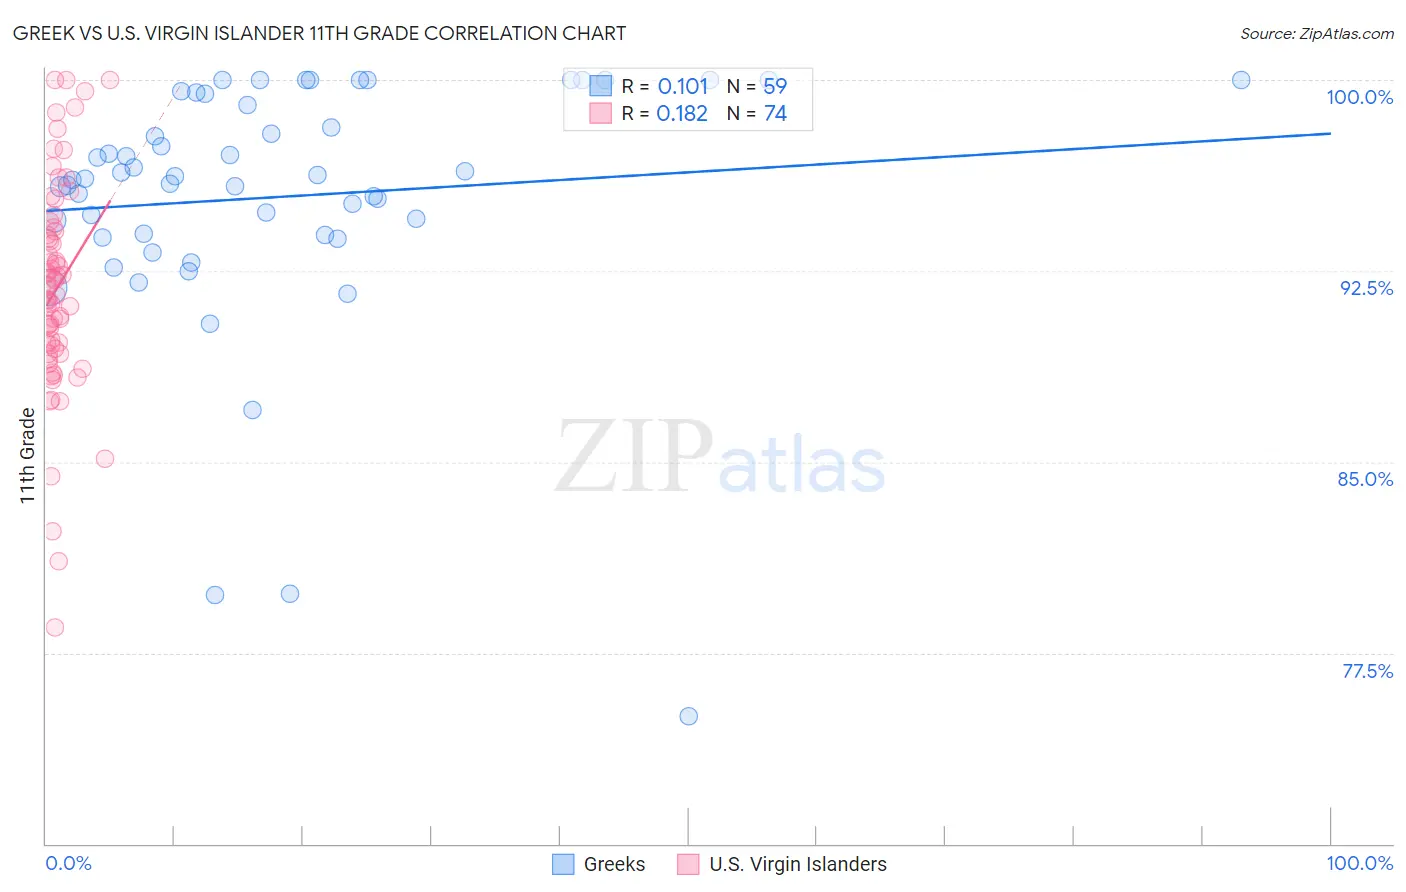
Greek vs U.S. Virgin Islander 11th Grade Correlation Chart
The statistical analysis conducted on geographies consisting of 482,775,362 people shows a poor positive correlation between the proportion of Greeks and percentage of population with at least 11th grade education in the United States with a correlation coefficient (R) of 0.101 and weighted average of 94.1%. Similarly, the statistical analysis conducted on geographies consisting of 87,529,315 people shows a poor positive correlation between the proportion of U.S. Virgin Islanders and percentage of population with at least 11th grade education in the United States with a correlation coefficient (R) of 0.182 and weighted average of 91.1%, a difference of 3.3%.
11th Grade Correlation Summary
| Measurement | Greek | U.S. Virgin Islander |
| Minimum | 75.0% | 78.5% |
| Maximum | 100.0% | 100.0% |
| Range | 25.0% | 21.5% |
| Mean | 95.4% | 91.8% |
| Median | 96.1% | 91.7% |
| Interquartile 25% (IQ1) | 93.9% | 89.4% |
| Interquartile 75% (IQ3) | 99.5% | 94.1% |
| Interquartile Range (IQR) | 5.5% | 4.7% |
| Standard Deviation (Sample) | 5.0% | 4.2% |
| Standard Deviation (Population) | 4.9% | 4.2% |
Similar Demographics by 11th Grade
Demographics Similar to Greeks by 11th Grade
In terms of 11th grade, the demographic groups most similar to Greeks are Cypriot (94.1%, a difference of 0.010%), Immigrants from Austria (94.1%, a difference of 0.010%), Immigrants from Ireland (94.1%, a difference of 0.010%), Immigrants from Lithuania (94.1%, a difference of 0.020%), and Thai (94.1%, a difference of 0.020%).
| Demographics | Rating | Rank | 11th Grade |
| Immigrants | Northern Europe | 99.9 /100 | #36 | Exceptional 94.2% |
| Northern Europeans | 99.9 /100 | #37 | Exceptional 94.2% |
| Hungarians | 99.9 /100 | #38 | Exceptional 94.2% |
| Immigrants | Lithuania | 99.9 /100 | #39 | Exceptional 94.1% |
| Thais | 99.9 /100 | #40 | Exceptional 94.1% |
| Cypriots | 99.9 /100 | #41 | Exceptional 94.1% |
| Immigrants | Austria | 99.9 /100 | #42 | Exceptional 94.1% |
| Greeks | 99.9 /100 | #43 | Exceptional 94.1% |
| Immigrants | Ireland | 99.9 /100 | #44 | Exceptional 94.1% |
| Australians | 99.9 /100 | #45 | Exceptional 94.1% |
| Serbians | 99.9 /100 | #46 | Exceptional 94.1% |
| Filipinos | 99.9 /100 | #47 | Exceptional 94.1% |
| Macedonians | 99.9 /100 | #48 | Exceptional 94.1% |
| Slavs | 99.9 /100 | #49 | Exceptional 94.1% |
| French | 99.9 /100 | #50 | Exceptional 94.1% |
Demographics Similar to U.S. Virgin Islanders by 11th Grade
In terms of 11th grade, the demographic groups most similar to U.S. Virgin Islanders are Ute (91.1%, a difference of 0.030%), Trinidadian and Tobagonian (91.1%, a difference of 0.060%), Immigrants from Jamaica (91.2%, a difference of 0.070%), Immigrants from Western Africa (91.2%, a difference of 0.080%), and Immigrants from Peru (91.0%, a difference of 0.090%).
| Demographics | Rating | Rank | 11th Grade |
| Taiwanese | 0.6 /100 | #261 | Tragic 91.3% |
| Immigrants | Uruguay | 0.5 /100 | #262 | Tragic 91.3% |
| Immigrants | Ghana | 0.3 /100 | #263 | Tragic 91.2% |
| Yup'ik | 0.3 /100 | #264 | Tragic 91.2% |
| Pueblo | 0.3 /100 | #265 | Tragic 91.2% |
| Immigrants | Western Africa | 0.3 /100 | #266 | Tragic 91.2% |
| Immigrants | Jamaica | 0.3 /100 | #267 | Tragic 91.2% |
| U.S. Virgin Islanders | 0.2 /100 | #268 | Tragic 91.1% |
| Ute | 0.2 /100 | #269 | Tragic 91.1% |
| Trinidadians and Tobagonians | 0.2 /100 | #270 | Tragic 91.1% |
| Immigrants | Peru | 0.1 /100 | #271 | Tragic 91.0% |
| West Indians | 0.1 /100 | #272 | Tragic 91.0% |
| Paiute | 0.1 /100 | #273 | Tragic 91.0% |
| Immigrants | Trinidad and Tobago | 0.1 /100 | #274 | Tragic 90.9% |
| Immigrants | South Eastern Asia | 0.1 /100 | #275 | Tragic 90.9% |