Romanian vs U.S. Virgin Islander Disability Age 65 to 74
COMPARE
Romanian
U.S. Virgin Islander
Disability Age 65 to 74
Disability Age 65 to 74 Comparison
Romanians
U.S. Virgin Islanders
22.1%
DISABILITY AGE 65 TO 74
97.7/ 100
METRIC RATING
95th/ 347
METRIC RANK
25.9%
DISABILITY AGE 65 TO 74
0.1/ 100
METRIC RATING
279th/ 347
METRIC RANK
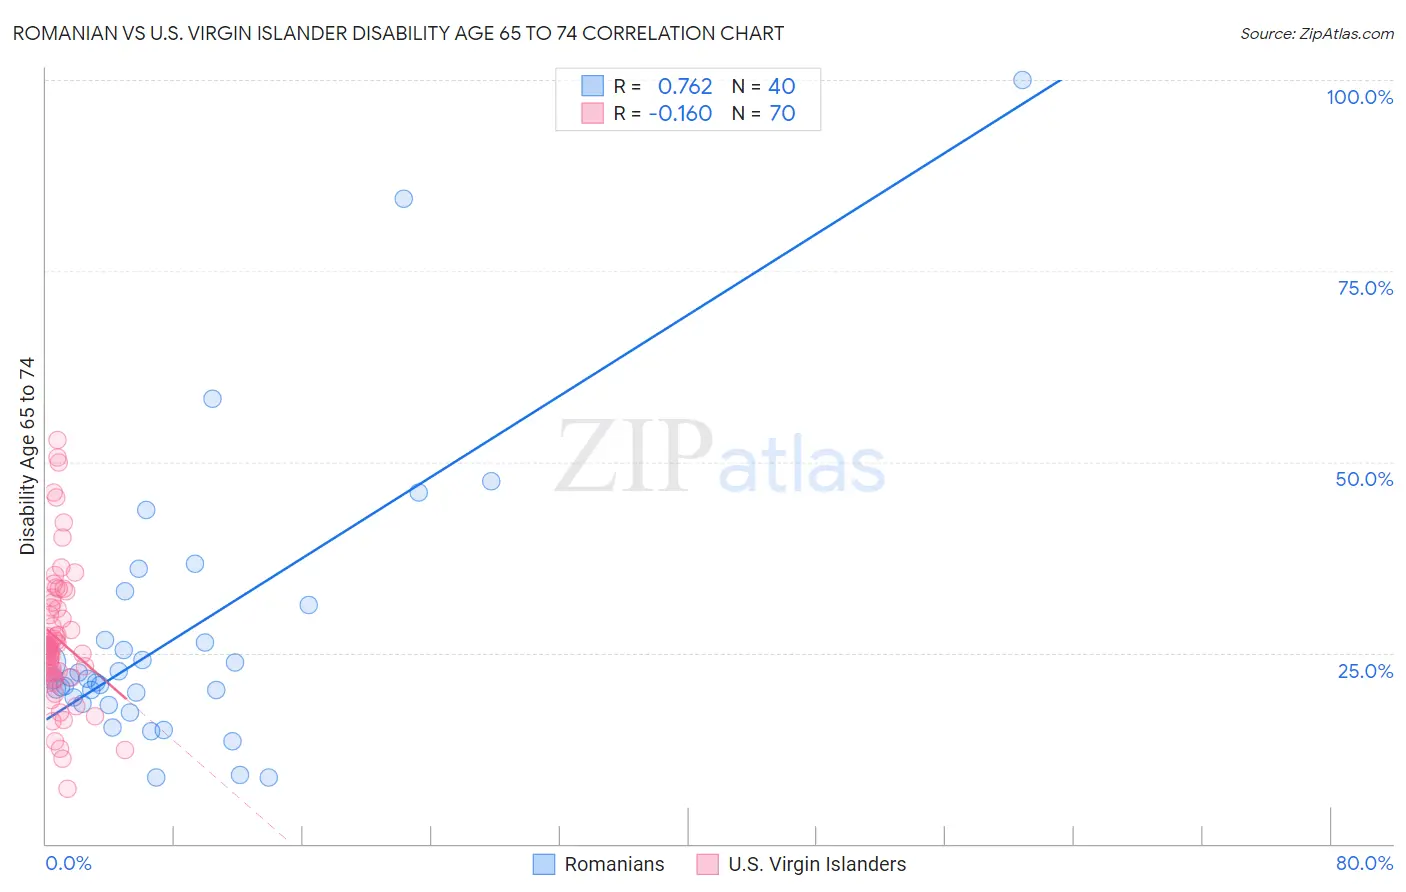
Romanian vs U.S. Virgin Islander Disability Age 65 to 74 Correlation Chart
The statistical analysis conducted on geographies consisting of 377,283,716 people shows a strong positive correlation between the proportion of Romanians and percentage of population with a disability between the ages 65 and 75 in the United States with a correlation coefficient (R) of 0.762 and weighted average of 22.1%. Similarly, the statistical analysis conducted on geographies consisting of 87,465,301 people shows a poor negative correlation between the proportion of U.S. Virgin Islanders and percentage of population with a disability between the ages 65 and 75 in the United States with a correlation coefficient (R) of -0.160 and weighted average of 25.9%, a difference of 17.2%.
Disability Age 65 to 74 Correlation Summary
| Measurement | Romanian | U.S. Virgin Islander |
| Minimum | 8.6% | 7.1% |
| Maximum | 100.0% | 52.9% |
| Range | 91.4% | 45.8% |
| Mean | 27.4% | 26.8% |
| Median | 21.6% | 25.6% |
| Interquartile 25% (IQ1) | 18.7% | 22.3% |
| Interquartile 75% (IQ3) | 29.0% | 30.9% |
| Interquartile Range (IQR) | 10.3% | 8.6% |
| Standard Deviation (Sample) | 18.5% | 9.0% |
| Standard Deviation (Population) | 18.3% | 9.0% |
Similar Demographics by Disability Age 65 to 74
Demographics Similar to Romanians by Disability Age 65 to 74
In terms of disability age 65 to 74, the demographic groups most similar to Romanians are Immigrants from Chile (22.1%, a difference of 0.060%), Immigrants from Canada (22.1%, a difference of 0.080%), Polish (22.0%, a difference of 0.11%), Immigrants from North America (22.1%, a difference of 0.11%), and Chilean (22.0%, a difference of 0.16%).
| Demographics | Rating | Rank | Disability Age 65 to 74 |
| Immigrants | Netherlands | 97.9 /100 | #88 | Exceptional 22.0% |
| Immigrants | Kuwait | 97.9 /100 | #89 | Exceptional 22.0% |
| Italians | 97.9 /100 | #90 | Exceptional 22.0% |
| Chileans | 97.9 /100 | #91 | Exceptional 22.0% |
| Poles | 97.8 /100 | #92 | Exceptional 22.0% |
| Immigrants | Canada | 97.8 /100 | #93 | Exceptional 22.1% |
| Immigrants | Chile | 97.7 /100 | #94 | Exceptional 22.1% |
| Romanians | 97.7 /100 | #95 | Exceptional 22.1% |
| Immigrants | North America | 97.5 /100 | #96 | Exceptional 22.1% |
| Immigrants | Southern Europe | 97.2 /100 | #97 | Exceptional 22.1% |
| Jordanians | 96.9 /100 | #98 | Exceptional 22.2% |
| Immigrants | Colombia | 96.8 /100 | #99 | Exceptional 22.2% |
| Uruguayans | 96.5 /100 | #100 | Exceptional 22.2% |
| Immigrants | England | 96.5 /100 | #101 | Exceptional 22.2% |
| Immigrants | Saudi Arabia | 96.4 /100 | #102 | Exceptional 22.2% |
Demographics Similar to U.S. Virgin Islanders by Disability Age 65 to 74
In terms of disability age 65 to 74, the demographic groups most similar to U.S. Virgin Islanders are Immigrants from Belize (25.8%, a difference of 0.080%), Cree (25.9%, a difference of 0.080%), Belizean (25.8%, a difference of 0.10%), Immigrants from Honduras (25.9%, a difference of 0.10%), and Delaware (25.9%, a difference of 0.18%).
| Demographics | Rating | Rank | Disability Age 65 to 74 |
| Immigrants | Dominica | 0.1 /100 | #272 | Tragic 25.7% |
| Japanese | 0.1 /100 | #273 | Tragic 25.7% |
| Americans | 0.1 /100 | #274 | Tragic 25.8% |
| Hondurans | 0.1 /100 | #275 | Tragic 25.8% |
| French American Indians | 0.1 /100 | #276 | Tragic 25.8% |
| Belizeans | 0.1 /100 | #277 | Tragic 25.8% |
| Immigrants | Belize | 0.1 /100 | #278 | Tragic 25.8% |
| U.S. Virgin Islanders | 0.1 /100 | #279 | Tragic 25.9% |
| Cree | 0.1 /100 | #280 | Tragic 25.9% |
| Immigrants | Honduras | 0.1 /100 | #281 | Tragic 25.9% |
| Delaware | 0.1 /100 | #282 | Tragic 25.9% |
| Spanish Americans | 0.0 /100 | #283 | Tragic 25.9% |
| Immigrants | Azores | 0.0 /100 | #284 | Tragic 26.0% |
| Immigrants | Congo | 0.0 /100 | #285 | Tragic 26.0% |
| Immigrants | Micronesia | 0.0 /100 | #286 | Tragic 26.1% |