Romanian vs Immigrants from Australia 11th Grade
COMPARE
Romanian
Immigrants from Australia
11th Grade
11th Grade Comparison
Romanians
Immigrants from Australia
93.8%
11TH GRADE
99.6/ 100
METRIC RATING
73rd/ 347
METRIC RANK
94.0%
11TH GRADE
99.9/ 100
METRIC RATING
53rd/ 347
METRIC RANK
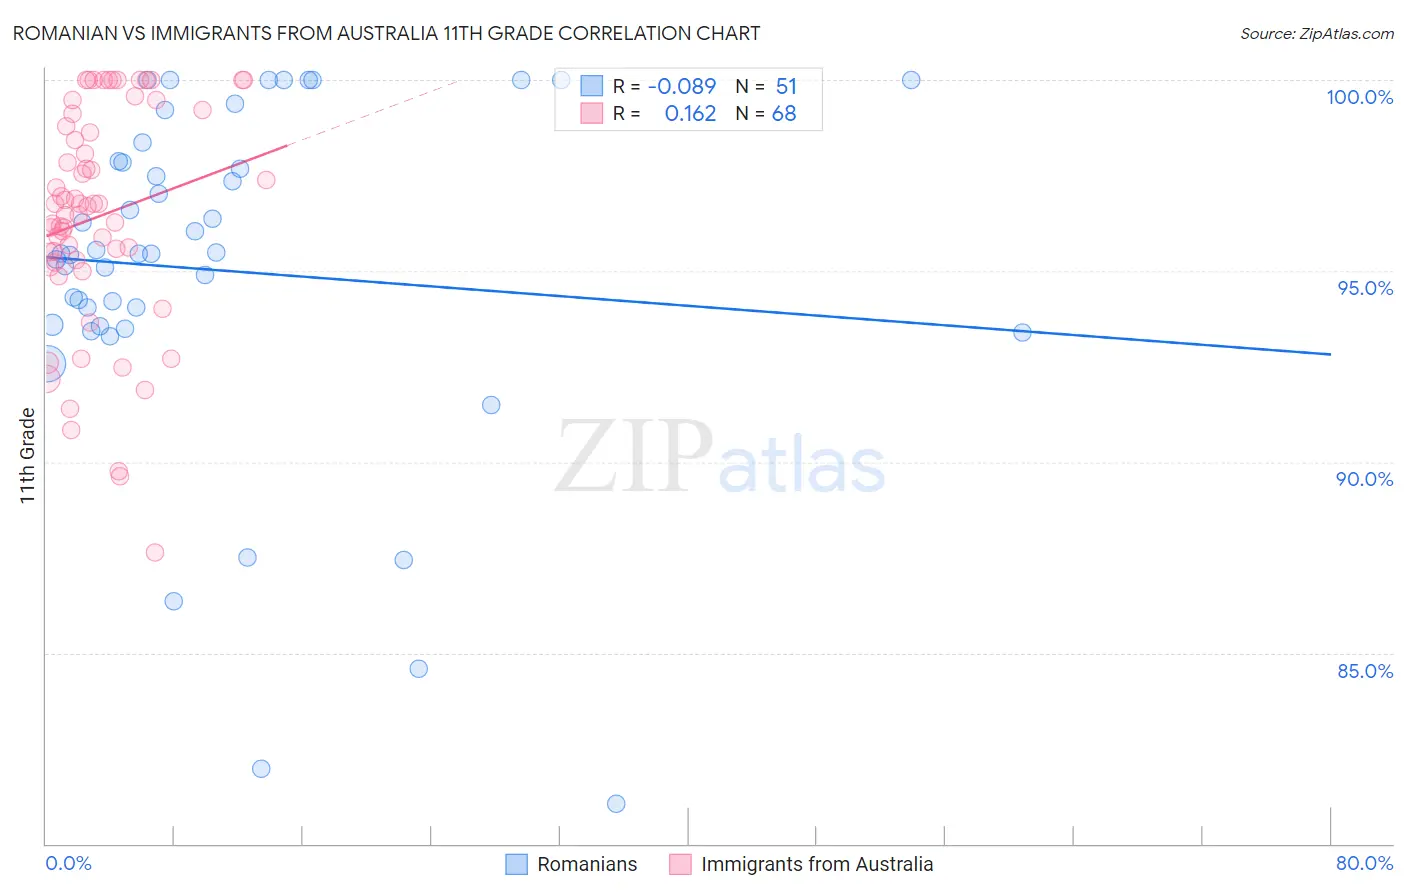
Romanian vs Immigrants from Australia 11th Grade Correlation Chart
The statistical analysis conducted on geographies consisting of 377,905,400 people shows a slight negative correlation between the proportion of Romanians and percentage of population with at least 11th grade education in the United States with a correlation coefficient (R) of -0.089 and weighted average of 93.8%. Similarly, the statistical analysis conducted on geographies consisting of 227,202,828 people shows a poor positive correlation between the proportion of Immigrants from Australia and percentage of population with at least 11th grade education in the United States with a correlation coefficient (R) of 0.162 and weighted average of 94.0%, a difference of 0.24%.
11th Grade Correlation Summary
| Measurement | Romanian | Immigrants from Australia |
| Minimum | 81.0% | 87.6% |
| Maximum | 100.0% | 100.0% |
| Range | 19.0% | 12.4% |
| Mean | 95.0% | 96.4% |
| Median | 95.5% | 96.7% |
| Interquartile 25% (IQ1) | 93.5% | 95.3% |
| Interquartile 75% (IQ3) | 97.9% | 98.9% |
| Interquartile Range (IQR) | 4.3% | 3.7% |
| Standard Deviation (Sample) | 4.5% | 2.9% |
| Standard Deviation (Population) | 4.5% | 2.9% |
Demographics Similar to Romanians and Immigrants from Australia by 11th Grade
In terms of 11th grade, the demographic groups most similar to Romanians are Immigrants from Japan (93.8%, a difference of 0.020%), Immigrants from South Africa (93.8%, a difference of 0.050%), Immigrants from England (93.8%, a difference of 0.060%), Scotch-Irish (93.9%, a difference of 0.11%), and Zimbabwean (93.9%, a difference of 0.12%). Similarly, the demographic groups most similar to Immigrants from Australia are Immigrants from North America (94.0%, a difference of 0.010%), Czechoslovakian (94.0%, a difference of 0.010%), French Canadian (94.0%, a difference of 0.020%), New Zealander (94.0%, a difference of 0.020%), and Iranian (94.0%, a difference of 0.020%).
| Demographics | Rating | Rank | 11th Grade |
| Immigrants | Australia | 99.9 /100 | #53 | Exceptional 94.0% |
| Immigrants | North America | 99.9 /100 | #54 | Exceptional 94.0% |
| Czechoslovakians | 99.9 /100 | #55 | Exceptional 94.0% |
| French Canadians | 99.9 /100 | #56 | Exceptional 94.0% |
| New Zealanders | 99.9 /100 | #57 | Exceptional 94.0% |
| Iranians | 99.9 /100 | #58 | Exceptional 94.0% |
| Bhutanese | 99.8 /100 | #59 | Exceptional 94.0% |
| Okinawans | 99.8 /100 | #60 | Exceptional 94.0% |
| Immigrants | Belgium | 99.8 /100 | #61 | Exceptional 94.0% |
| Austrians | 99.8 /100 | #62 | Exceptional 94.0% |
| Ukrainians | 99.8 /100 | #63 | Exceptional 94.0% |
| Immigrants | Sweden | 99.8 /100 | #64 | Exceptional 93.9% |
| Native Hawaiians | 99.8 /100 | #65 | Exceptional 93.9% |
| Alaskan Athabascans | 99.8 /100 | #66 | Exceptional 93.9% |
| Immigrants | Netherlands | 99.8 /100 | #67 | Exceptional 93.9% |
| Zimbabweans | 99.8 /100 | #68 | Exceptional 93.9% |
| Scotch-Irish | 99.8 /100 | #69 | Exceptional 93.9% |
| Immigrants | England | 99.7 /100 | #70 | Exceptional 93.8% |
| Immigrants | South Africa | 99.7 /100 | #71 | Exceptional 93.8% |
| Immigrants | Japan | 99.7 /100 | #72 | Exceptional 93.8% |
| Romanians | 99.6 /100 | #73 | Exceptional 93.8% |