Romanian vs Immigrants from Uruguay Bachelor's Degree
COMPARE
Romanian
Immigrants from Uruguay
Bachelor's Degree
Bachelor's Degree Comparison
Romanians
Immigrants from Uruguay
41.6%
BACHELOR'S DEGREE
98.4/ 100
METRIC RATING
97th/ 347
METRIC RANK
37.8%
BACHELOR'S DEGREE
48.3/ 100
METRIC RATING
175th/ 347
METRIC RANK
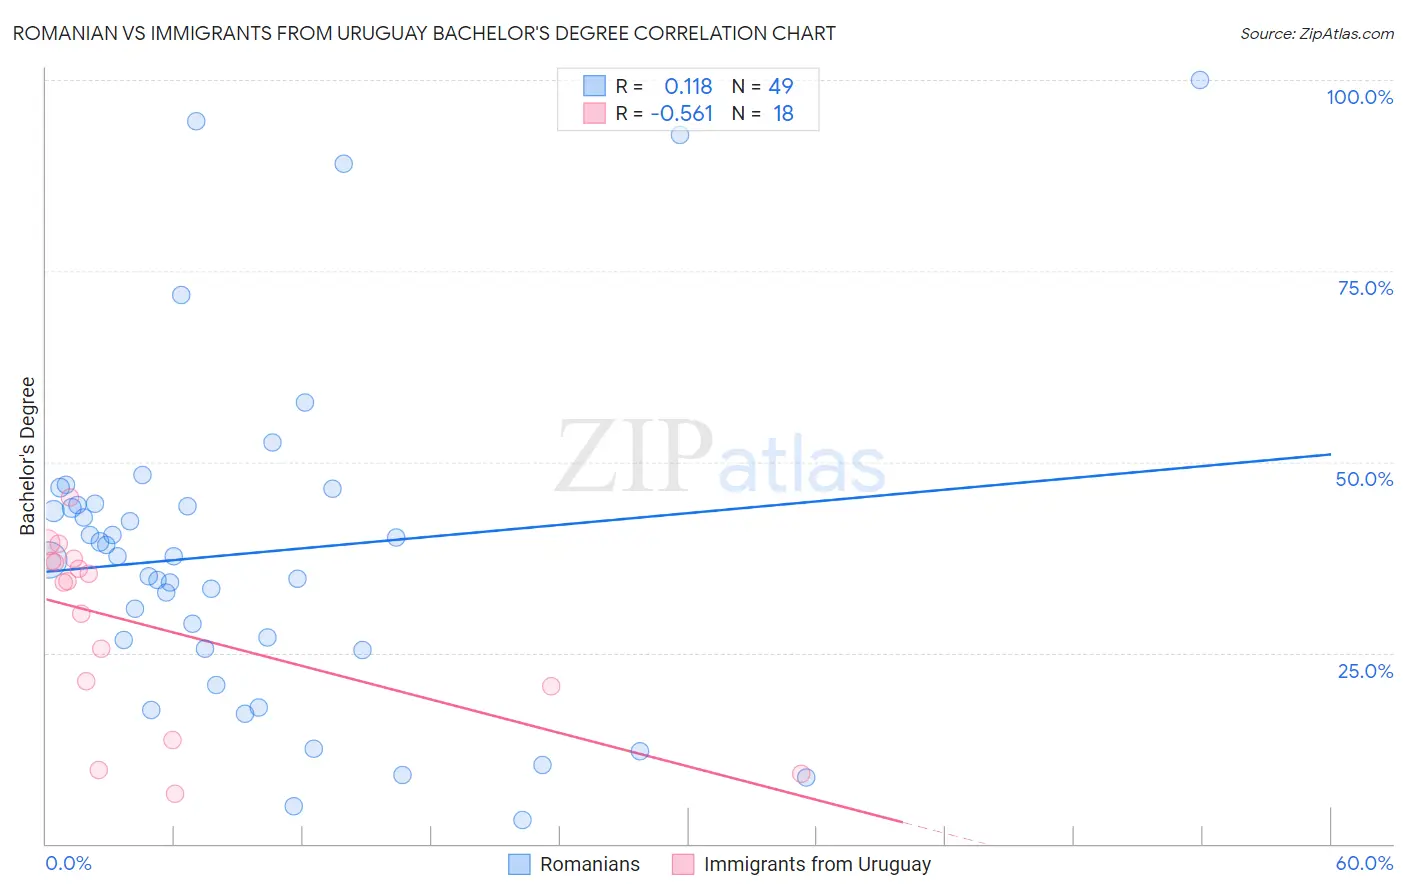
Romanian vs Immigrants from Uruguay Bachelor's Degree Correlation Chart
The statistical analysis conducted on geographies consisting of 377,865,873 people shows a poor positive correlation between the proportion of Romanians and percentage of population with at least bachelor's degree education in the United States with a correlation coefficient (R) of 0.118 and weighted average of 41.6%. Similarly, the statistical analysis conducted on geographies consisting of 133,259,667 people shows a substantial negative correlation between the proportion of Immigrants from Uruguay and percentage of population with at least bachelor's degree education in the United States with a correlation coefficient (R) of -0.561 and weighted average of 37.8%, a difference of 10.1%.
Bachelor's Degree Correlation Summary
| Measurement | Romanian | Immigrants from Uruguay |
| Minimum | 3.1% | 6.5% |
| Maximum | 100.0% | 45.3% |
| Range | 96.9% | 38.8% |
| Mean | 38.1% | 28.4% |
| Median | 37.6% | 34.4% |
| Interquartile 25% (IQ1) | 25.5% | 20.6% |
| Interquartile 75% (IQ3) | 44.4% | 37.0% |
| Interquartile Range (IQR) | 18.9% | 16.4% |
| Standard Deviation (Sample) | 22.1% | 12.1% |
| Standard Deviation (Population) | 21.9% | 11.7% |
Similar Demographics by Bachelor's Degree
Demographics Similar to Romanians by Bachelor's Degree
In terms of bachelor's degree, the demographic groups most similar to Romanians are Immigrants from Moldova (41.6%, a difference of 0.050%), Immigrants from Ukraine (41.5%, a difference of 0.11%), Immigrants from North America (41.7%, a difference of 0.16%), Immigrants from Nepal (41.7%, a difference of 0.29%), and Immigrants from Canada (41.7%, a difference of 0.31%).
| Demographics | Rating | Rank | Bachelor's Degree |
| Laotians | 98.9 /100 | #90 | Exceptional 42.0% |
| Immigrants | Northern Africa | 98.9 /100 | #91 | Exceptional 41.9% |
| Maltese | 98.8 /100 | #92 | Exceptional 41.9% |
| Immigrants | Canada | 98.6 /100 | #93 | Exceptional 41.7% |
| Immigrants | Nepal | 98.6 /100 | #94 | Exceptional 41.7% |
| Immigrants | North America | 98.5 /100 | #95 | Exceptional 41.7% |
| Immigrants | Moldova | 98.4 /100 | #96 | Exceptional 41.6% |
| Romanians | 98.4 /100 | #97 | Exceptional 41.6% |
| Immigrants | Ukraine | 98.3 /100 | #98 | Exceptional 41.5% |
| Immigrants | England | 98.1 /100 | #99 | Exceptional 41.4% |
| Macedonians | 98.1 /100 | #100 | Exceptional 41.4% |
| Immigrants | Morocco | 98.0 /100 | #101 | Exceptional 41.4% |
| Immigrants | Italy | 97.8 /100 | #102 | Exceptional 41.3% |
| Chileans | 97.5 /100 | #103 | Exceptional 41.2% |
| Jordanians | 97.4 /100 | #104 | Exceptional 41.2% |
Demographics Similar to Immigrants from Uruguay by Bachelor's Degree
In terms of bachelor's degree, the demographic groups most similar to Immigrants from Uruguay are Costa Rican (37.7%, a difference of 0.080%), Basque (37.7%, a difference of 0.090%), Immigrants from Cameroon (37.7%, a difference of 0.15%), Immigrants from Bangladesh (37.8%, a difference of 0.16%), and Immigrants from Colombia (37.7%, a difference of 0.29%).
| Demographics | Rating | Rank | Bachelor's Degree |
| Danes | 56.2 /100 | #168 | Average 38.1% |
| Ghanaians | 55.3 /100 | #169 | Average 38.0% |
| Czechs | 54.4 /100 | #170 | Average 38.0% |
| Bermudans | 54.2 /100 | #171 | Average 38.0% |
| Immigrants | Somalia | 52.8 /100 | #172 | Average 37.9% |
| Immigrants | Iraq | 52.5 /100 | #173 | Average 37.9% |
| Immigrants | Bangladesh | 50.0 /100 | #174 | Average 37.8% |
| Immigrants | Uruguay | 48.3 /100 | #175 | Average 37.8% |
| Costa Ricans | 47.6 /100 | #176 | Average 37.7% |
| Basques | 47.4 /100 | #177 | Average 37.7% |
| Immigrants | Cameroon | 46.8 /100 | #178 | Average 37.7% |
| Immigrants | Colombia | 45.4 /100 | #179 | Average 37.7% |
| Irish | 44.3 /100 | #180 | Average 37.6% |
| Immigrants | Senegal | 43.8 /100 | #181 | Average 37.6% |
| Immigrants | Bosnia and Herzegovina | 43.4 /100 | #182 | Average 37.6% |