Romanian vs Estonian Bachelor's Degree
COMPARE
Romanian
Estonian
Bachelor's Degree
Bachelor's Degree Comparison
Romanians
Estonians
41.6%
BACHELOR'S DEGREE
98.4/ 100
METRIC RATING
97th/ 347
METRIC RANK
44.6%
BACHELOR'S DEGREE
99.9/ 100
METRIC RATING
48th/ 347
METRIC RANK
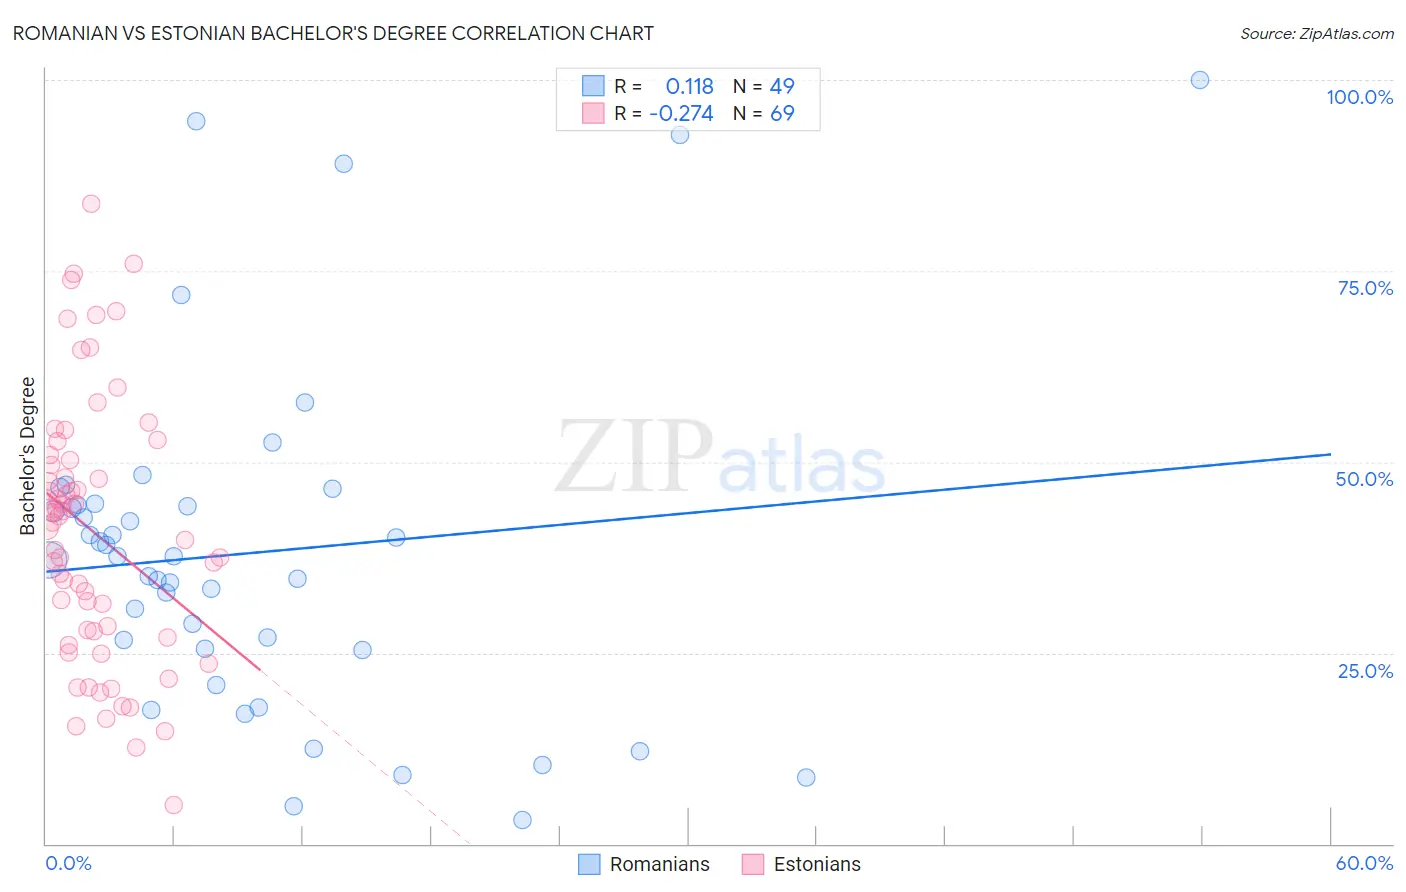
Romanian vs Estonian Bachelor's Degree Correlation Chart
The statistical analysis conducted on geographies consisting of 377,865,873 people shows a poor positive correlation between the proportion of Romanians and percentage of population with at least bachelor's degree education in the United States with a correlation coefficient (R) of 0.118 and weighted average of 41.6%. Similarly, the statistical analysis conducted on geographies consisting of 123,528,478 people shows a weak negative correlation between the proportion of Estonians and percentage of population with at least bachelor's degree education in the United States with a correlation coefficient (R) of -0.274 and weighted average of 44.6%, a difference of 7.1%.
Bachelor's Degree Correlation Summary
| Measurement | Romanian | Estonian |
| Minimum | 3.1% | 5.1% |
| Maximum | 100.0% | 83.7% |
| Range | 96.9% | 78.7% |
| Mean | 38.1% | 40.9% |
| Median | 37.6% | 42.0% |
| Interquartile 25% (IQ1) | 25.5% | 27.5% |
| Interquartile 75% (IQ3) | 44.4% | 50.5% |
| Interquartile Range (IQR) | 18.9% | 23.1% |
| Standard Deviation (Sample) | 22.1% | 17.3% |
| Standard Deviation (Population) | 21.9% | 17.1% |
Similar Demographics by Bachelor's Degree
Demographics Similar to Romanians by Bachelor's Degree
In terms of bachelor's degree, the demographic groups most similar to Romanians are Immigrants from Moldova (41.6%, a difference of 0.050%), Immigrants from Ukraine (41.5%, a difference of 0.11%), Immigrants from North America (41.7%, a difference of 0.16%), Immigrants from Nepal (41.7%, a difference of 0.29%), and Immigrants from Canada (41.7%, a difference of 0.31%).
| Demographics | Rating | Rank | Bachelor's Degree |
| Laotians | 98.9 /100 | #90 | Exceptional 42.0% |
| Immigrants | Northern Africa | 98.9 /100 | #91 | Exceptional 41.9% |
| Maltese | 98.8 /100 | #92 | Exceptional 41.9% |
| Immigrants | Canada | 98.6 /100 | #93 | Exceptional 41.7% |
| Immigrants | Nepal | 98.6 /100 | #94 | Exceptional 41.7% |
| Immigrants | North America | 98.5 /100 | #95 | Exceptional 41.7% |
| Immigrants | Moldova | 98.4 /100 | #96 | Exceptional 41.6% |
| Romanians | 98.4 /100 | #97 | Exceptional 41.6% |
| Immigrants | Ukraine | 98.3 /100 | #98 | Exceptional 41.5% |
| Immigrants | England | 98.1 /100 | #99 | Exceptional 41.4% |
| Macedonians | 98.1 /100 | #100 | Exceptional 41.4% |
| Immigrants | Morocco | 98.0 /100 | #101 | Exceptional 41.4% |
| Immigrants | Italy | 97.8 /100 | #102 | Exceptional 41.3% |
| Chileans | 97.5 /100 | #103 | Exceptional 41.2% |
| Jordanians | 97.4 /100 | #104 | Exceptional 41.2% |
Demographics Similar to Estonians by Bachelor's Degree
In terms of bachelor's degree, the demographic groups most similar to Estonians are Bolivian (44.6%, a difference of 0.0%), Immigrants from Bulgaria (44.6%, a difference of 0.040%), Immigrants from Kuwait (44.6%, a difference of 0.10%), Immigrants from Lithuania (44.6%, a difference of 0.12%), and Immigrants from Norway (44.5%, a difference of 0.12%).
| Demographics | Rating | Rank | Bachelor's Degree |
| Immigrants | Malaysia | 100.0 /100 | #41 | Exceptional 45.0% |
| Immigrants | Saudi Arabia | 100.0 /100 | #42 | Exceptional 44.8% |
| Immigrants | South Africa | 99.9 /100 | #43 | Exceptional 44.8% |
| Immigrants | Lithuania | 99.9 /100 | #44 | Exceptional 44.6% |
| Immigrants | Kuwait | 99.9 /100 | #45 | Exceptional 44.6% |
| Immigrants | Bulgaria | 99.9 /100 | #46 | Exceptional 44.6% |
| Bolivians | 99.9 /100 | #47 | Exceptional 44.6% |
| Estonians | 99.9 /100 | #48 | Exceptional 44.6% |
| Immigrants | Norway | 99.9 /100 | #49 | Exceptional 44.5% |
| Immigrants | Greece | 99.9 /100 | #50 | Exceptional 44.5% |
| Asians | 99.9 /100 | #51 | Exceptional 44.4% |
| Immigrants | Spain | 99.9 /100 | #52 | Exceptional 44.3% |
| Immigrants | Asia | 99.9 /100 | #53 | Exceptional 44.3% |
| Immigrants | Austria | 99.9 /100 | #54 | Exceptional 44.2% |
| Immigrants | Bolivia | 99.9 /100 | #55 | Exceptional 44.2% |