Korean vs Immigrants from Australia 11th Grade
COMPARE
Korean
Immigrants from Australia
11th Grade
11th Grade Comparison
Koreans
Immigrants from Australia
92.1%
11TH GRADE
14.4/ 100
METRIC RATING
212th/ 347
METRIC RANK
94.0%
11TH GRADE
99.9/ 100
METRIC RATING
53rd/ 347
METRIC RANK
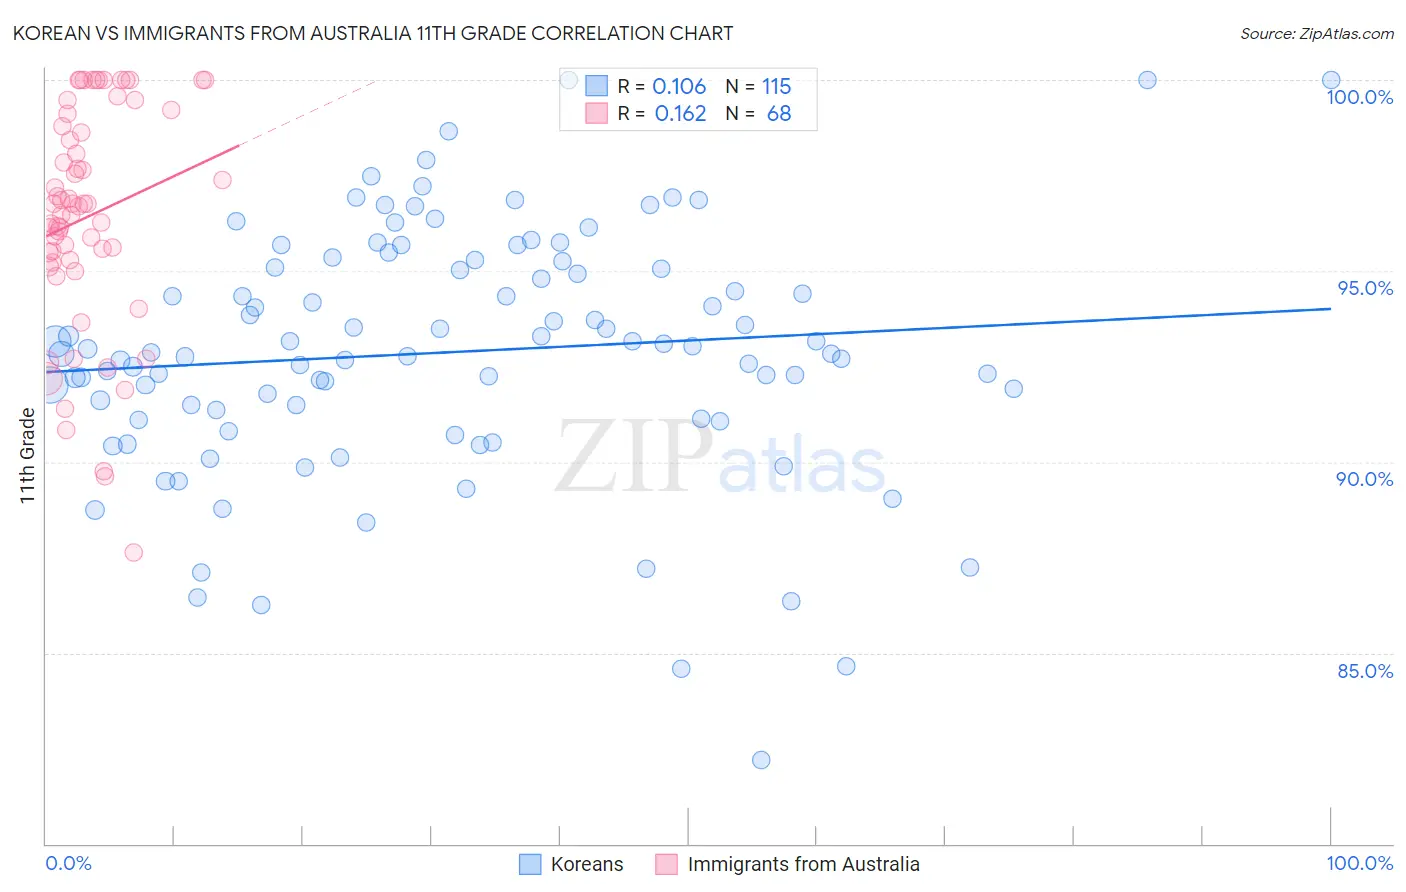
Korean vs Immigrants from Australia 11th Grade Correlation Chart
The statistical analysis conducted on geographies consisting of 510,943,943 people shows a poor positive correlation between the proportion of Koreans and percentage of population with at least 11th grade education in the United States with a correlation coefficient (R) of 0.106 and weighted average of 92.1%. Similarly, the statistical analysis conducted on geographies consisting of 227,202,828 people shows a poor positive correlation between the proportion of Immigrants from Australia and percentage of population with at least 11th grade education in the United States with a correlation coefficient (R) of 0.162 and weighted average of 94.0%, a difference of 2.1%.
11th Grade Correlation Summary
| Measurement | Korean | Immigrants from Australia |
| Minimum | 82.2% | 87.6% |
| Maximum | 100.0% | 100.0% |
| Range | 17.8% | 12.4% |
| Mean | 92.9% | 96.4% |
| Median | 92.9% | 96.7% |
| Interquartile 25% (IQ1) | 91.1% | 95.3% |
| Interquartile 75% (IQ3) | 95.1% | 98.9% |
| Interquartile Range (IQR) | 3.9% | 3.7% |
| Standard Deviation (Sample) | 3.2% | 2.9% |
| Standard Deviation (Population) | 3.2% | 2.9% |
Similar Demographics by 11th Grade
Demographics Similar to Koreans by 11th Grade
In terms of 11th grade, the demographic groups most similar to Koreans are Immigrants from Ethiopia (92.1%, a difference of 0.010%), Afghan (92.1%, a difference of 0.030%), Immigrants from Southern Europe (92.1%, a difference of 0.040%), Immigrants from Micronesia (92.2%, a difference of 0.060%), and Somali (92.1%, a difference of 0.060%).
| Demographics | Rating | Rank | 11th Grade |
| Kiowa | 23.2 /100 | #205 | Fair 92.2% |
| Bolivians | 23.2 /100 | #206 | Fair 92.2% |
| Immigrants | Oceania | 22.4 /100 | #207 | Fair 92.2% |
| Colville | 21.8 /100 | #208 | Fair 92.2% |
| Tongans | 19.8 /100 | #209 | Poor 92.2% |
| Ethiopians | 18.8 /100 | #210 | Poor 92.2% |
| Immigrants | Micronesia | 17.7 /100 | #211 | Poor 92.2% |
| Koreans | 14.4 /100 | #212 | Poor 92.1% |
| Immigrants | Ethiopia | 13.9 /100 | #213 | Poor 92.1% |
| Afghans | 12.8 /100 | #214 | Poor 92.1% |
| Immigrants | Southern Europe | 12.5 /100 | #215 | Poor 92.1% |
| Somalis | 11.6 /100 | #216 | Poor 92.1% |
| Immigrants | Sierra Leone | 11.1 /100 | #217 | Poor 92.0% |
| Blackfeet | 10.1 /100 | #218 | Poor 92.0% |
| Portuguese | 10.0 /100 | #219 | Tragic 92.0% |
Demographics Similar to Immigrants from Australia by 11th Grade
In terms of 11th grade, the demographic groups most similar to Immigrants from Australia are Immigrants from Canada (94.0%, a difference of 0.010%), Immigrants from North America (94.0%, a difference of 0.010%), Czechoslovakian (94.0%, a difference of 0.010%), Turkish (94.0%, a difference of 0.020%), and French Canadian (94.0%, a difference of 0.020%).
| Demographics | Rating | Rank | 11th Grade |
| Serbians | 99.9 /100 | #46 | Exceptional 94.1% |
| Filipinos | 99.9 /100 | #47 | Exceptional 94.1% |
| Macedonians | 99.9 /100 | #48 | Exceptional 94.1% |
| Slavs | 99.9 /100 | #49 | Exceptional 94.1% |
| French | 99.9 /100 | #50 | Exceptional 94.1% |
| Turks | 99.9 /100 | #51 | Exceptional 94.0% |
| Immigrants | Canada | 99.9 /100 | #52 | Exceptional 94.0% |
| Immigrants | Australia | 99.9 /100 | #53 | Exceptional 94.0% |
| Immigrants | North America | 99.9 /100 | #54 | Exceptional 94.0% |
| Czechoslovakians | 99.9 /100 | #55 | Exceptional 94.0% |
| French Canadians | 99.9 /100 | #56 | Exceptional 94.0% |
| New Zealanders | 99.9 /100 | #57 | Exceptional 94.0% |
| Iranians | 99.9 /100 | #58 | Exceptional 94.0% |
| Bhutanese | 99.8 /100 | #59 | Exceptional 94.0% |
| Okinawans | 99.8 /100 | #60 | Exceptional 94.0% |