Burmese vs Immigrants from Australia 11th Grade

COMPARE

Burmese
Race
Ancestry
AfghanAfricanAlaska NativeAlaskan AthabascanAlbanianAleutAlsatianAmericanApacheArabArapahoArgentineanArmenianAssyrian/Chaldean/SyriacAustralianAustrianBahamianBangladeshiBarbadianBasqueBelgianBelizeanBermudanBhutaneseBlackfeetBolivianBrazilianBritishBritish West IndianBulgarianBurmeseCajunCambodianCanadianCape VerdeanCarpatho RusynCelticCentral AmericanCentral American IndianCherokeeCheyenneChickasawChileanChineseChippewaChoctawColombianColvilleComancheCosta RicanCreeCreekCroatianCrowCubanCypriotCzechCzechoslovakianDanishDelawareDominicanDutchDutch West IndianEastern EuropeanEcuadorianEgyptianEnglishEstonianEthiopianEuropeanFijianFilipinoFinnishFrenchFrench American IndianFrench CanadianGermanGerman RussianGhanaianGreekGuamanian/ChamorroGuatemalanGuyaneseHaitianHmongHonduranHopiHoumaHungarianIcelanderIndian (Asian)IndonesianInupiatIranianIraqiIrishIroquoisIsraeliItalianJamaicanJapaneseJordanianKenyanKiowaKoreanLaotianLatvianLebaneseLiberianLithuanianLumbeeLuxembourgerMacedonianMalaysianMalteseMarshalleseMenomineeMexicanMexican American IndianMongolianMoroccanNative HawaiianNavajoNepaleseNew ZealanderNicaraguanNigerianNorthern EuropeanNorwegianOkinawanOsageOttawaPaiutePakistaniPalestinianPanamanianParaguayanPennsylvania GermanPeruvianPimaPolishPortuguesePotawatomiPuebloPuerto RicanPuget Sound SalishRomanianRussianSalvadoranSamoanScandinavianScotch-IrishScottishSeminoleSenegaleseSerbianShoshoneSierra LeoneanSiouxSlavicSlovakSloveneSomaliSouth AfricanSouth AmericanSouth American IndianSoviet UnionSpaniardSpanishSpanish AmericanSpanish American IndianSri LankanSubsaharan AfricanSudaneseSwedishSwissSyrianTaiwaneseThaiTlingit-HaidaTohono O'OdhamTonganTrinidadian and TobagonianTsimshianTurkishU.S. Virgin IslanderUgandanUkrainianUruguayanUteVenezuelanVietnameseWelshWest IndianYakamaYaquiYugoslavianYumanYup'ikZimbabwean
Immigration
NonimmigrantsImmigrantsAfghanistanAfricaAlbaniaArgentinaArmeniaAsiaAustriaBahamasBangladeshBarbadosBelarusBelgiumBelizeBoliviaBosnia and HerzegovinaBrazilBulgariaBurma/MyanmarCabo VerdeCambodiaCameroonCanadaCaribbeanCentral AmericaChileChinaColombiaCongoCosta RicaCroatiaCubaCzechoslovakiaDenmarkDominicaDominican RepublicEastern AfricaEastern AsiaEastern EuropeEcuadorEgyptEl SalvadorEnglandEritreaEthiopiaEuropeFijiFranceGermanyGhanaGreeceGrenadaGuatemalaGuyanaHaitiHondurasHong KongHungaryIndiaIndonesiaIranIraqIrelandIsraelItalyJamaicaJapanJordanKazakhstanKenyaKoreaKuwaitLaosLatin AmericaLatviaLebanonLiberiaLithuaniaMalaysiaMexicoMicronesiaMiddle AfricaMoldovaMoroccoNepalNetherlandsNicaraguaNigeriaNorth AmericaNorth MacedoniaNorthern AfricaNorthern EuropeNorwayOceaniaPakistanPanamaPeruPhilippinesPolandPortugalRomaniaRussiaSaudi ArabiaScotlandSenegalSerbiaSierra LeoneSingaporeSomaliaSouth AfricaSouth AmericaSouth Central AsiaSouth Eastern AsiaSouthern EuropeSpainSri LankaSt. Vincent and the GrenadinesSudanSwedenSwitzerlandSyriaTaiwanThailandTrinidad and TobagoTurkeyUgandaUkraineUruguayUzbekistanVenezuelaVietnamWest IndiesWestern AfricaWestern AsiaWestern EuropeYemenZaireZimbabweAzores
Immigrants from Australia
Race
Ancestry
AfghanAfricanAlaska NativeAlaskan AthabascanAlbanianAleutAlsatianAmericanApacheArabArapahoArgentineanArmenianAssyrian/Chaldean/SyriacAustralianAustrianBahamianBangladeshiBarbadianBasqueBelgianBelizeanBermudanBhutaneseBlackfeetBolivianBrazilianBritishBritish West IndianBulgarianCajunCambodianCanadianCape VerdeanCarpatho RusynCelticCentral AmericanCentral American IndianCherokeeCheyenneChickasawChileanChineseChippewaChoctawColombianColvilleComancheCosta RicanCreeCreekCroatianCrowCubanCypriotCzechCzechoslovakianDanishDelawareDominicanDutchDutch West IndianEastern EuropeanEcuadorianEgyptianEnglishEstonianEthiopianEuropeanFijianFilipinoFinnishFrenchFrench American IndianFrench CanadianGermanGerman RussianGhanaianGreekGuamanian/ChamorroGuatemalanGuyaneseHaitianHmongHonduranHopiHoumaHungarianIcelanderIndian (Asian)IndonesianInupiatIranianIraqiIrishIroquoisIsraeliItalianJamaicanJapaneseJordanianKenyanKiowaKoreanLaotianLatvianLebaneseLiberianLithuanianLumbeeLuxembourgerMacedonianMalaysianMalteseMarshalleseMenomineeMexicanMexican American IndianMongolianMoroccanNative HawaiianNavajoNepaleseNew ZealanderNicaraguanNigerianNorthern EuropeanNorwegianOkinawanOsageOttawaPaiutePakistaniPalestinianPanamanianParaguayanPennsylvania GermanPeruvianPimaPolishPortuguesePotawatomiPuebloPuerto RicanPuget Sound SalishRomanianRussianSalvadoranSamoanScandinavianScotch-IrishScottishSeminoleSenegaleseSerbianShoshoneSierra LeoneanSiouxSlavicSlovakSloveneSomaliSouth AfricanSouth AmericanSouth American IndianSoviet UnionSpaniardSpanishSpanish AmericanSpanish American IndianSri LankanSubsaharan AfricanSudaneseSwedishSwissSyrianTaiwaneseThaiTlingit-HaidaTohono O'OdhamTonganTrinidadian and TobagonianTsimshianTurkishU.S. Virgin IslanderUgandanUkrainianUruguayanUteVenezuelanVietnameseWelshWest IndianYakamaYaquiYugoslavianYumanYup'ikZimbabwean
Immigration
NonimmigrantsImmigrantsAfghanistanAfricaAlbaniaArgentinaArmeniaAsiaAustraliaAustriaBahamasBangladeshBarbadosBelarusBelgiumBelizeBoliviaBosnia and HerzegovinaBrazilBulgariaBurma/MyanmarCabo VerdeCambodiaCameroonCanadaCaribbeanCentral AmericaChileChinaColombiaCongoCosta RicaCroatiaCubaCzechoslovakiaDenmarkDominicaDominican RepublicEastern AfricaEastern AsiaEastern EuropeEcuadorEgyptEl SalvadorEnglandEritreaEthiopiaEuropeFijiFranceGermanyGhanaGreeceGrenadaGuatemalaGuyanaHaitiHondurasHong KongHungaryIndiaIndonesiaIranIraqIrelandIsraelItalyJamaicaJapanJordanKazakhstanKenyaKoreaKuwaitLaosLatin AmericaLatviaLebanonLiberiaLithuaniaMalaysiaMexicoMicronesiaMiddle AfricaMoldovaMoroccoNepalNetherlandsNicaraguaNigeriaNorth AmericaNorth MacedoniaNorthern AfricaNorthern EuropeNorwayOceaniaPakistanPanamaPeruPhilippinesPolandPortugalRomaniaRussiaSaudi ArabiaScotlandSenegalSerbiaSierra LeoneSingaporeSomaliaSouth AfricaSouth AmericaSouth Central AsiaSouth Eastern AsiaSouthern EuropeSpainSri LankaSt. Vincent and the GrenadinesSudanSwedenSwitzerlandSyriaTaiwanThailandTrinidad and TobagoTurkeyUgandaUkraineUruguayUzbekistanVenezuelaVietnamWest IndiesWestern AfricaWestern AsiaWestern EuropeYemenZaireZimbabweAzores
11th Grade
Income
Poverty
Unemployment
Labor Participation
Family Structure
Vehicle Availability
Education Level
Disability

11th Grade Comparison

Burmese

Immigrants from Australia

Exceptional
Exceptional
93.6%
11TH GRADE
99.2/ 100
METRIC RATING
89th/ 347
METRIC RANK
94.0%
11TH GRADE
99.9/ 100
METRIC RATING
53rd/ 347
METRIC RANK

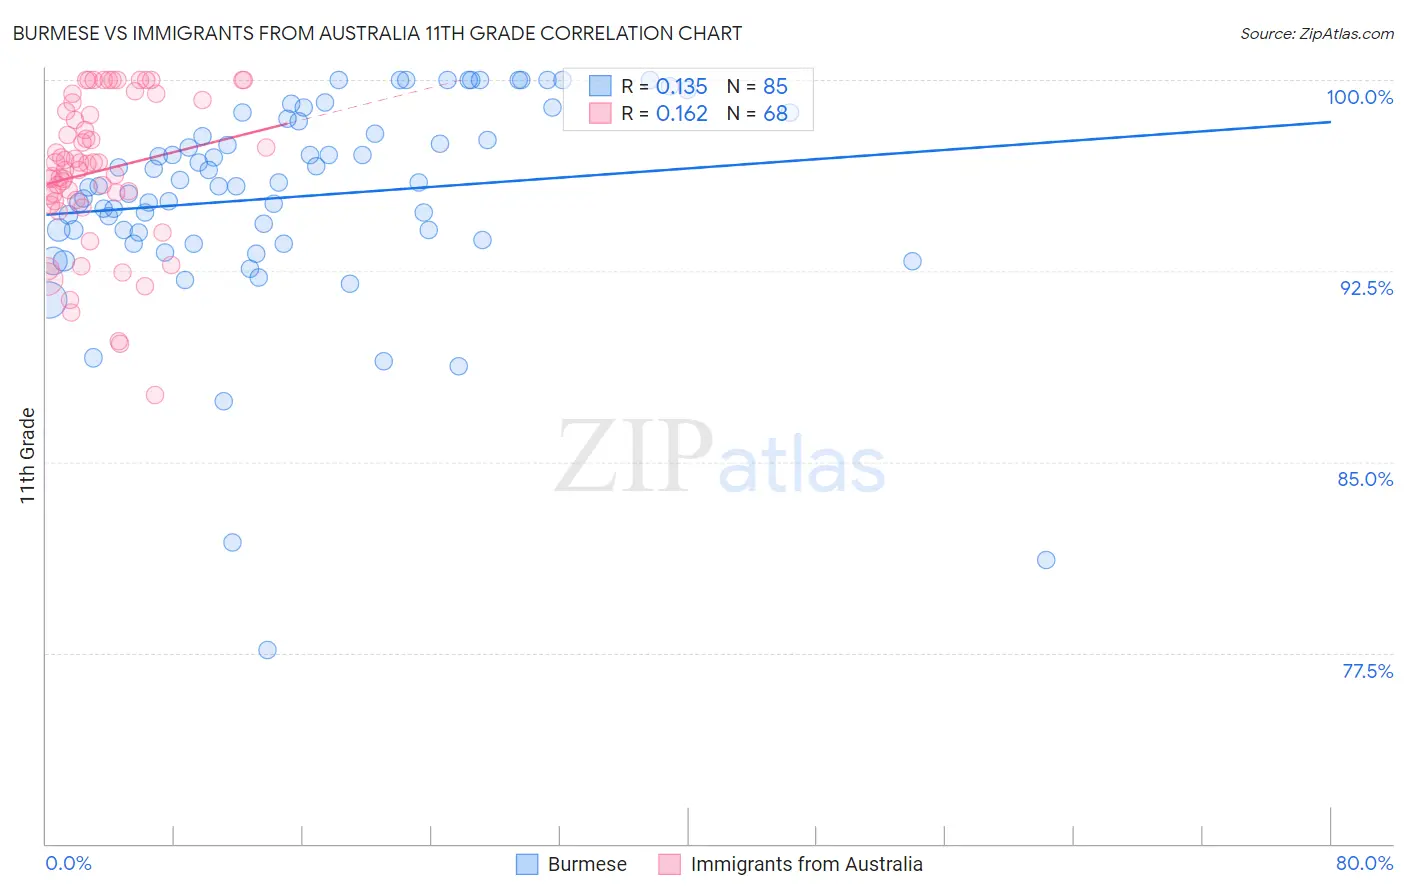
Burmese vs Immigrants from Australia 11th Grade Correlation Chart

The statistical analysis conducted on geographies consisting of 465,370,495 people shows a poor positive correlation between the proportion of Burmese and percentage of population with at least 11th grade education in the United States with a correlation coefficient (R) of 0.135 and weighted average of 93.6%. Similarly, the statistical analysis conducted on geographies consisting of 227,202,828 people shows a poor positive correlation between the proportion of Immigrants from Australia and percentage of population with at least 11th grade education in the United States with a correlation coefficient (R) of 0.162 and weighted average of 94.0%, a difference of 0.42%.
Burmese vs Immigrants from Australia 11th Grade

11th Grade Correlation Summary

MeasurementBurmeseImmigrants from Australia
Minimum77.6%87.6%
Maximum100.0%100.0%
Range22.4%12.4%
Mean95.4%96.4%
Median95.8%96.7%
Interquartile 25% (IQ1)93.9%95.3%
Interquartile 75% (IQ3)98.4%98.9%
Interquartile Range (IQR)4.6%3.7%
Standard Deviation (Sample)4.1%2.9%
Standard Deviation (Population)4.1%2.9%

Similar Demographics by 11th Grade

Demographics Similar to Burmese by 11th Grade

In terms of 11th grade, the demographic groups most similar to Burmese are Immigrants from South Central Asia (93.6%, a difference of 0.0%), Immigrants from Western Europe (93.6%, a difference of 0.0%), Cambodian (93.6%, a difference of 0.0%), Immigrants from Switzerland (93.6%, a difference of 0.010%), and Ottawa (93.6%, a difference of 0.010%).
DemographicsRating | Rank11th Grade
Immigrants | Saudi Arabia
99.3
/100
|
#82
Exceptional
93.7%
Icelanders
99.3
/100
|
#83
Exceptional
93.6%
Immigrants | Taiwan
99.3
/100
|
#84
Exceptional
93.6%
Immigrants | Switzerland
99.3
/100
|
#85
Exceptional
93.6%
Immigrants | South Central Asia
99.2
/100
|
#86
Exceptional
93.6%
Immigrants | Western Europe
99.2
/100
|
#87
Exceptional
93.6%
Cambodians
99.2
/100
|
#88
Exceptional
93.6%
Burmese
99.2
/100
|
#89
Exceptional
93.6%
Ottawa
99.2
/100
|
#90
Exceptional
93.6%
South Africans
99.2
/100
|
#91
Exceptional
93.6%
Immigrants | Bulgaria
99.1
/100
|
#92
Exceptional
93.6%
Puget Sound Salish
99.1
/100
|
#93
Exceptional
93.6%
Swiss
99.0
/100
|
#94
Exceptional
93.6%
Immigrants | France
99.0
/100
|
#95
Exceptional
93.6%
Immigrants | Turkey
98.9
/100
|
#96
Exceptional
93.5%

Demographics Similar to Immigrants from Australia by 11th Grade

In terms of 11th grade, the demographic groups most similar to Immigrants from Australia are Immigrants from Canada (94.0%, a difference of 0.010%), Immigrants from North America (94.0%, a difference of 0.010%), Czechoslovakian (94.0%, a difference of 0.010%), Turkish (94.0%, a difference of 0.020%), and French Canadian (94.0%, a difference of 0.020%).
DemographicsRating | Rank11th Grade
Serbians
99.9
/100
|
#46
Exceptional
94.1%
Filipinos
99.9
/100
|
#47
Exceptional
94.1%
Macedonians
99.9
/100
|
#48
Exceptional
94.1%
Slavs
99.9
/100
|
#49
Exceptional
94.1%
French
99.9
/100
|
#50
Exceptional
94.1%
Turks
99.9
/100
|
#51
Exceptional
94.0%
Immigrants | Canada
99.9
/100
|
#52
Exceptional
94.0%
Immigrants | Australia
99.9
/100
|
#53
Exceptional
94.0%
Immigrants | North America
99.9
/100
|
#54
Exceptional
94.0%
Czechoslovakians
99.9
/100
|
#55
Exceptional
94.0%
French Canadians
99.9
/100
|
#56
Exceptional
94.0%
New Zealanders
99.9
/100
|
#57
Exceptional
94.0%
Iranians
99.9
/100
|
#58
Exceptional
94.0%
Bhutanese
99.8
/100
|
#59
Exceptional
94.0%
Okinawans
99.8
/100
|
#60
Exceptional
94.0%