Native/Alaskan vs Immigrants from Mexico Nursery School
COMPARE
Native/Alaskan
Immigrants from Mexico
Nursery School
Nursery School Comparison
Natives/Alaskans
Immigrants from Mexico
98.0%
NURSERY SCHOOL
48.6/ 100
METRIC RATING
178th/ 347
METRIC RANK
96.4%
NURSERY SCHOOL
0.0/ 100
METRIC RATING
342nd/ 347
METRIC RANK
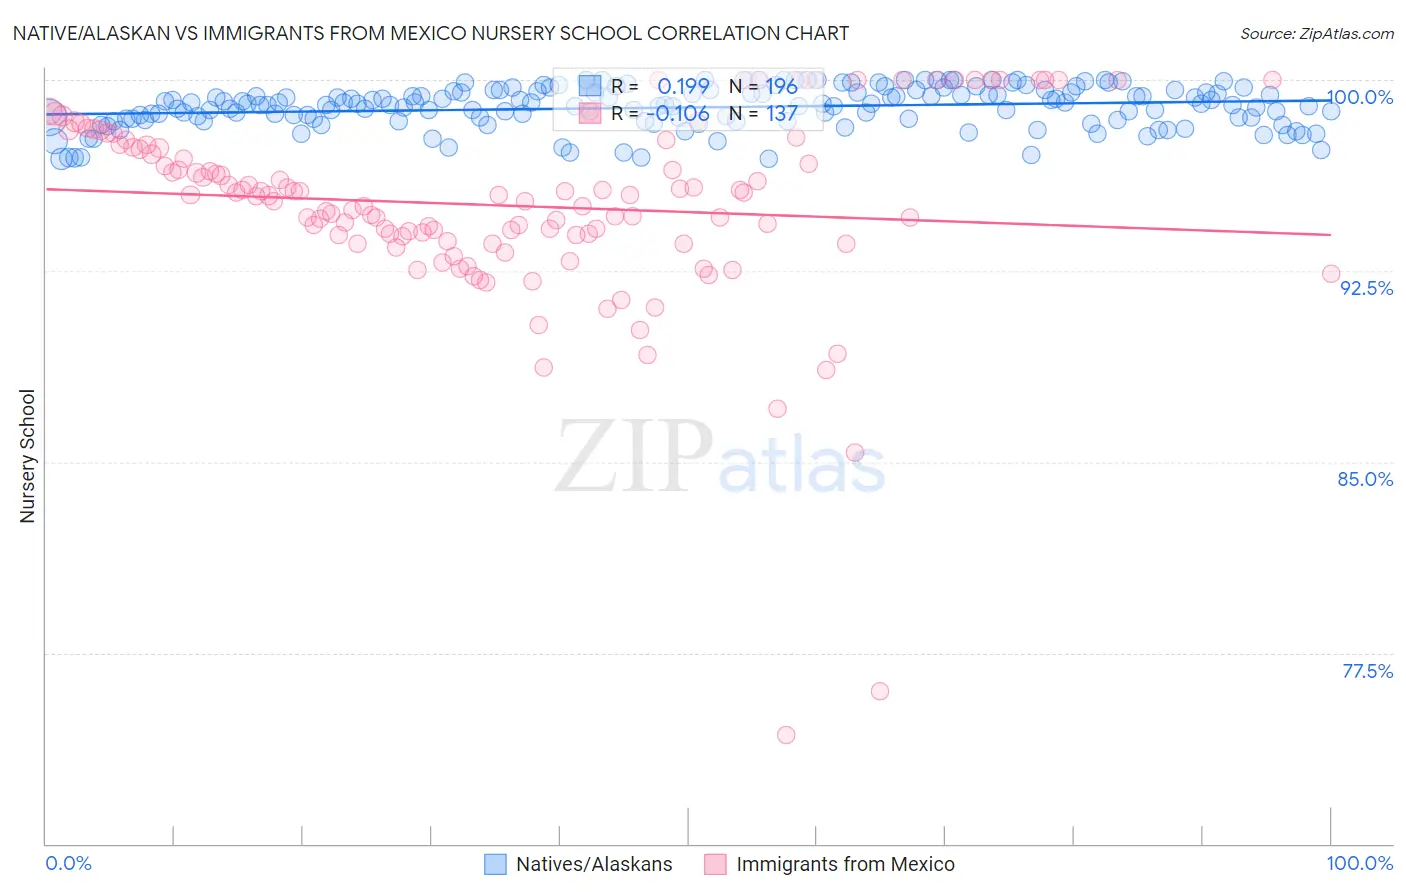
Native/Alaskan vs Immigrants from Mexico Nursery School Correlation Chart
The statistical analysis conducted on geographies consisting of 513,036,548 people shows a poor positive correlation between the proportion of Natives/Alaskans and percentage of population with at least nursery school education in the United States with a correlation coefficient (R) of 0.199 and weighted average of 98.0%. Similarly, the statistical analysis conducted on geographies consisting of 513,767,418 people shows a poor negative correlation between the proportion of Immigrants from Mexico and percentage of population with at least nursery school education in the United States with a correlation coefficient (R) of -0.106 and weighted average of 96.4%, a difference of 1.7%.
Nursery School Correlation Summary
| Measurement | Native/Alaskan | Immigrants from Mexico |
| Minimum | 96.9% | 74.3% |
| Maximum | 100.0% | 100.0% |
| Range | 3.1% | 25.7% |
| Mean | 98.9% | 95.1% |
| Median | 99.0% | 95.5% |
| Interquartile 25% (IQ1) | 98.5% | 93.8% |
| Interquartile 75% (IQ3) | 99.5% | 97.4% |
| Interquartile Range (IQR) | 1.1% | 3.6% |
| Standard Deviation (Sample) | 0.79% | 3.8% |
| Standard Deviation (Population) | 0.79% | 3.8% |
Similar Demographics by Nursery School
Demographics Similar to Natives/Alaskans by Nursery School
In terms of nursery school, the demographic groups most similar to Natives/Alaskans are Kenyan (98.0%, a difference of 0.0%), Navajo (98.0%, a difference of 0.0%), Immigrants from Sri Lanka (98.0%, a difference of 0.0%), Immigrants from Venezuela (98.0%, a difference of 0.0%), and Albanian (98.0%, a difference of 0.0%).
| Demographics | Rating | Rank | Nursery School |
| Immigrants | Jordan | 53.4 /100 | #171 | Average 98.0% |
| Immigrants | Brazil | 51.3 /100 | #172 | Average 98.0% |
| Kenyans | 50.2 /100 | #173 | Average 98.0% |
| Navajo | 50.0 /100 | #174 | Average 98.0% |
| Immigrants | Sri Lanka | 49.9 /100 | #175 | Average 98.0% |
| Immigrants | Venezuela | 49.8 /100 | #176 | Average 98.0% |
| Albanians | 48.9 /100 | #177 | Average 98.0% |
| Natives/Alaskans | 48.6 /100 | #178 | Average 98.0% |
| Argentineans | 46.8 /100 | #179 | Average 98.0% |
| Immigrants | Bosnia and Herzegovina | 45.6 /100 | #180 | Average 98.0% |
| Egyptians | 42.8 /100 | #181 | Average 98.0% |
| Paiute | 42.0 /100 | #182 | Average 98.0% |
| Portuguese | 41.8 /100 | #183 | Average 98.0% |
| Immigrants | Poland | 41.3 /100 | #184 | Average 98.0% |
| Immigrants | Belarus | 41.0 /100 | #185 | Average 98.0% |
Demographics Similar to Immigrants from Mexico by Nursery School
In terms of nursery school, the demographic groups most similar to Immigrants from Mexico are Immigrants from Cabo Verde (96.4%, a difference of 0.010%), Immigrants from Central America (96.4%, a difference of 0.030%), Salvadoran (96.4%, a difference of 0.030%), Immigrants from Guatemala (96.4%, a difference of 0.060%), and Immigrants from Cambodia (96.5%, a difference of 0.14%).
| Demographics | Rating | Rank | Nursery School |
| Central Americans | 0.0 /100 | #333 | Tragic 96.6% |
| Immigrants | Dominican Republic | 0.0 /100 | #334 | Tragic 96.6% |
| Bangladeshis | 0.0 /100 | #335 | Tragic 96.6% |
| Guatemalans | 0.0 /100 | #336 | Tragic 96.6% |
| Immigrants | Cambodia | 0.0 /100 | #337 | Tragic 96.5% |
| Immigrants | Fiji | 0.0 /100 | #338 | Tragic 96.5% |
| Immigrants | Guatemala | 0.0 /100 | #339 | Tragic 96.4% |
| Immigrants | Central America | 0.0 /100 | #340 | Tragic 96.4% |
| Immigrants | Cabo Verde | 0.0 /100 | #341 | Tragic 96.4% |
| Immigrants | Mexico | 0.0 /100 | #342 | Tragic 96.4% |
| Salvadorans | 0.0 /100 | #343 | Tragic 96.4% |
| Immigrants | El Salvador | 0.0 /100 | #344 | Tragic 96.2% |
| Nepalese | 0.0 /100 | #345 | Tragic 96.2% |
| Immigrants | Yemen | 0.0 /100 | #346 | Tragic 95.9% |
| Spanish American Indians | 0.0 /100 | #347 | Tragic 95.8% |