Immigrants from Bulgaria vs Immigrants from Mexico Nursery School
COMPARE
Immigrants from Bulgaria
Immigrants from Mexico
Nursery School
Nursery School Comparison
Immigrants from Bulgaria
Immigrants from Mexico
98.1%
NURSERY SCHOOL
89.4/ 100
METRIC RATING
134th/ 347
METRIC RANK
96.4%
NURSERY SCHOOL
0.0/ 100
METRIC RATING
342nd/ 347
METRIC RANK
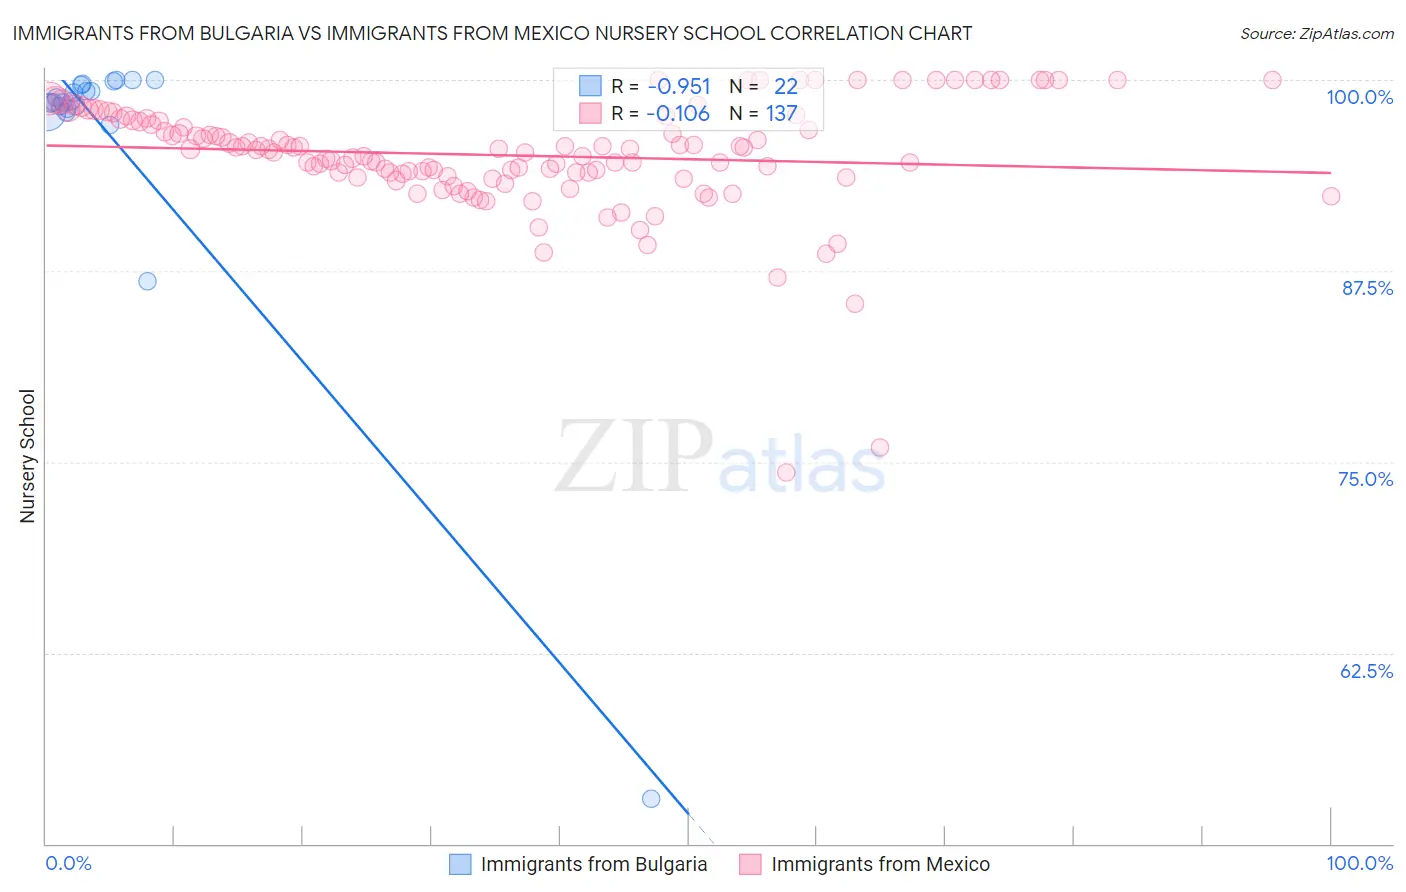
Immigrants from Bulgaria vs Immigrants from Mexico Nursery School Correlation Chart
The statistical analysis conducted on geographies consisting of 172,552,181 people shows a perfect negative correlation between the proportion of Immigrants from Bulgaria and percentage of population with at least nursery school education in the United States with a correlation coefficient (R) of -0.951 and weighted average of 98.1%. Similarly, the statistical analysis conducted on geographies consisting of 513,767,418 people shows a poor negative correlation between the proportion of Immigrants from Mexico and percentage of population with at least nursery school education in the United States with a correlation coefficient (R) of -0.106 and weighted average of 96.4%, a difference of 1.8%.
Nursery School Correlation Summary
| Measurement | Immigrants from Bulgaria | Immigrants from Mexico |
| Minimum | 52.9% | 74.3% |
| Maximum | 100.0% | 100.0% |
| Range | 47.1% | 25.7% |
| Mean | 96.2% | 95.1% |
| Median | 98.6% | 95.5% |
| Interquartile 25% (IQ1) | 98.2% | 93.8% |
| Interquartile 75% (IQ3) | 99.7% | 97.4% |
| Interquartile Range (IQR) | 1.5% | 3.6% |
| Standard Deviation (Sample) | 10.0% | 3.8% |
| Standard Deviation (Population) | 9.8% | 3.8% |
Similar Demographics by Nursery School
Demographics Similar to Immigrants from Bulgaria by Nursery School
In terms of nursery school, the demographic groups most similar to Immigrants from Bulgaria are Immigrants from Hungary (98.1%, a difference of 0.0%), Immigrants from Kuwait (98.1%, a difference of 0.0%), Spaniard (98.2%, a difference of 0.010%), Seminole (98.2%, a difference of 0.010%), and Immigrants from Europe (98.1%, a difference of 0.010%).
| Demographics | Rating | Rank | Nursery School |
| Immigrants | Saudi Arabia | 93.4 /100 | #127 | Exceptional 98.2% |
| Immigrants | Serbia | 92.4 /100 | #128 | Exceptional 98.2% |
| Cambodians | 91.4 /100 | #129 | Exceptional 98.2% |
| Immigrants | Croatia | 91.4 /100 | #130 | Exceptional 98.2% |
| Spaniards | 91.1 /100 | #131 | Exceptional 98.2% |
| Seminole | 90.9 /100 | #132 | Exceptional 98.2% |
| Immigrants | Europe | 90.7 /100 | #133 | Exceptional 98.1% |
| Immigrants | Bulgaria | 89.4 /100 | #134 | Excellent 98.1% |
| Immigrants | Hungary | 89.3 /100 | #135 | Excellent 98.1% |
| Immigrants | Kuwait | 88.9 /100 | #136 | Excellent 98.1% |
| Israelis | 88.2 /100 | #137 | Excellent 98.1% |
| Immigrants | Romania | 88.0 /100 | #138 | Excellent 98.1% |
| Blackfeet | 87.5 /100 | #139 | Excellent 98.1% |
| Palestinians | 83.7 /100 | #140 | Excellent 98.1% |
| Immigrants | Turkey | 83.0 /100 | #141 | Excellent 98.1% |
Demographics Similar to Immigrants from Mexico by Nursery School
In terms of nursery school, the demographic groups most similar to Immigrants from Mexico are Immigrants from Cabo Verde (96.4%, a difference of 0.010%), Immigrants from Central America (96.4%, a difference of 0.030%), Salvadoran (96.4%, a difference of 0.030%), Immigrants from Guatemala (96.4%, a difference of 0.060%), and Immigrants from Cambodia (96.5%, a difference of 0.14%).
| Demographics | Rating | Rank | Nursery School |
| Central Americans | 0.0 /100 | #333 | Tragic 96.6% |
| Immigrants | Dominican Republic | 0.0 /100 | #334 | Tragic 96.6% |
| Bangladeshis | 0.0 /100 | #335 | Tragic 96.6% |
| Guatemalans | 0.0 /100 | #336 | Tragic 96.6% |
| Immigrants | Cambodia | 0.0 /100 | #337 | Tragic 96.5% |
| Immigrants | Fiji | 0.0 /100 | #338 | Tragic 96.5% |
| Immigrants | Guatemala | 0.0 /100 | #339 | Tragic 96.4% |
| Immigrants | Central America | 0.0 /100 | #340 | Tragic 96.4% |
| Immigrants | Cabo Verde | 0.0 /100 | #341 | Tragic 96.4% |
| Immigrants | Mexico | 0.0 /100 | #342 | Tragic 96.4% |
| Salvadorans | 0.0 /100 | #343 | Tragic 96.4% |
| Immigrants | El Salvador | 0.0 /100 | #344 | Tragic 96.2% |
| Nepalese | 0.0 /100 | #345 | Tragic 96.2% |
| Immigrants | Yemen | 0.0 /100 | #346 | Tragic 95.9% |
| Spanish American Indians | 0.0 /100 | #347 | Tragic 95.8% |