Immigrants from Grenada vs Immigrants from Burma/Myanmar 7th Grade
COMPARE
Immigrants from Grenada
Immigrants from Burma/Myanmar
7th Grade
7th Grade Comparison
Immigrants from Grenada
Immigrants from Burma/Myanmar
94.8%
7TH GRADE
0.0/ 100
METRIC RATING
291st/ 347
METRIC RANK
94.5%
7TH GRADE
0.0/ 100
METRIC RATING
300th/ 347
METRIC RANK
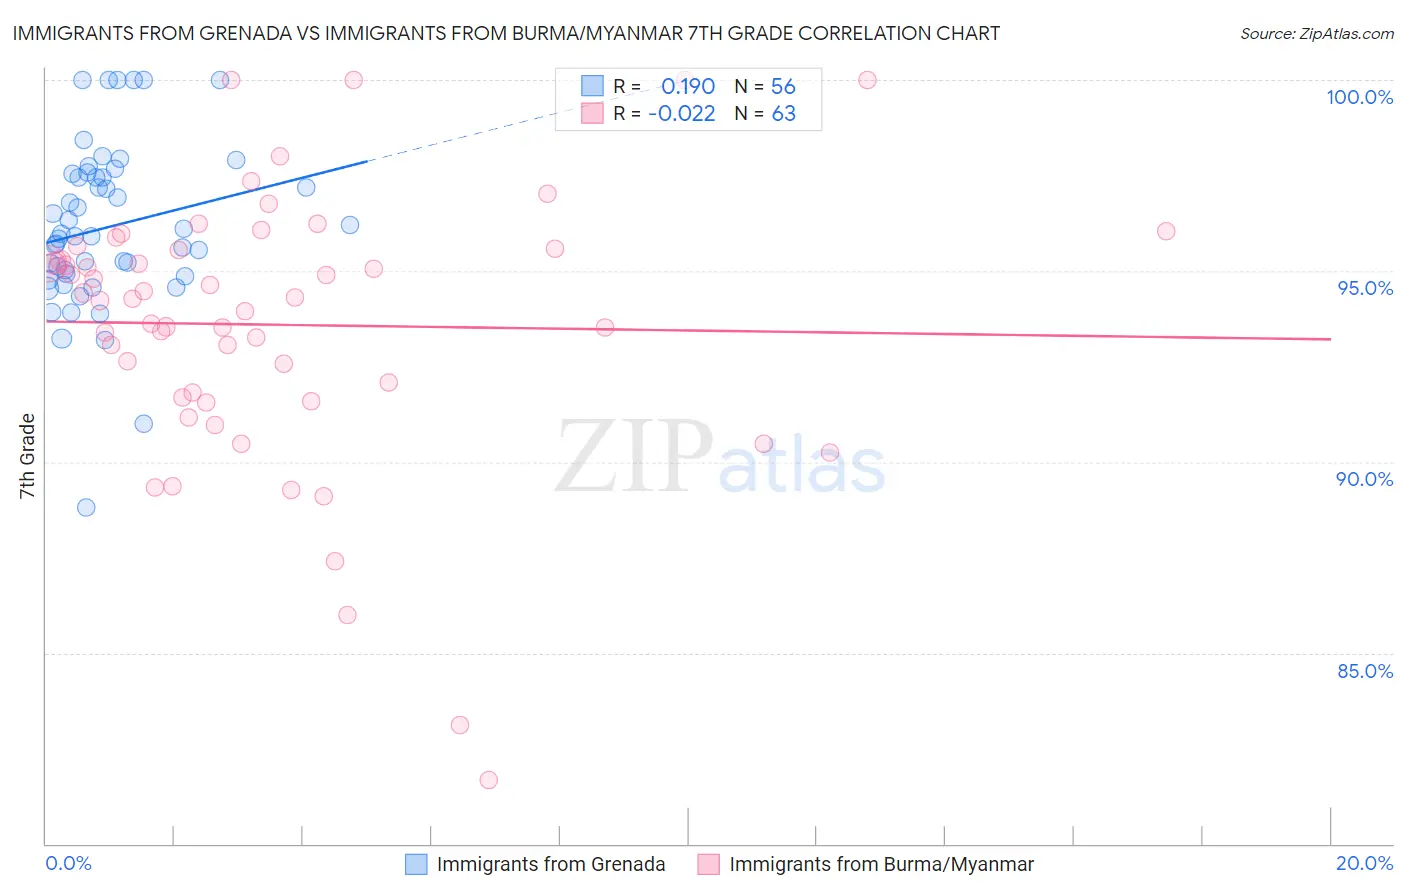
Immigrants from Grenada vs Immigrants from Burma/Myanmar 7th Grade Correlation Chart
The statistical analysis conducted on geographies consisting of 67,191,509 people shows a poor positive correlation between the proportion of Immigrants from Grenada and percentage of population with at least 7th grade education in the United States with a correlation coefficient (R) of 0.190 and weighted average of 94.8%. Similarly, the statistical analysis conducted on geographies consisting of 172,345,696 people shows no correlation between the proportion of Immigrants from Burma/Myanmar and percentage of population with at least 7th grade education in the United States with a correlation coefficient (R) of -0.022 and weighted average of 94.5%, a difference of 0.31%.
7th Grade Correlation Summary
| Measurement | Immigrants from Grenada | Immigrants from Burma/Myanmar |
| Minimum | 88.8% | 81.7% |
| Maximum | 100.0% | 100.0% |
| Range | 11.2% | 18.3% |
| Mean | 96.2% | 93.6% |
| Median | 95.9% | 94.3% |
| Interquartile 25% (IQ1) | 94.9% | 91.7% |
| Interquartile 75% (IQ3) | 97.5% | 95.6% |
| Interquartile Range (IQR) | 2.6% | 3.9% |
| Standard Deviation (Sample) | 2.2% | 3.6% |
| Standard Deviation (Population) | 2.2% | 3.5% |
Demographics Similar to Immigrants from Grenada and Immigrants from Burma/Myanmar by 7th Grade
In terms of 7th grade, the demographic groups most similar to Immigrants from Grenada are Immigrants from West Indies (94.8%, a difference of 0.020%), Malaysian (94.8%, a difference of 0.040%), Fijian (94.7%, a difference of 0.040%), Taiwanese (94.8%, a difference of 0.060%), and British West Indian (94.8%, a difference of 0.070%). Similarly, the demographic groups most similar to Immigrants from Burma/Myanmar are Immigrants from Dominica (94.5%, a difference of 0.030%), Immigrants from Laos (94.5%, a difference of 0.030%), Immigrants from South Eastern Asia (94.5%, a difference of 0.040%), Indonesian (94.5%, a difference of 0.040%), and Bangladeshi (94.5%, a difference of 0.040%).
| Demographics | Rating | Rank | 7th Grade |
| Immigrants | Eritrea | 0.1 /100 | #285 | Tragic 94.9% |
| Immigrants | Philippines | 0.0 /100 | #286 | Tragic 94.9% |
| Immigrants | Peru | 0.0 /100 | #287 | Tragic 94.9% |
| British West Indians | 0.0 /100 | #288 | Tragic 94.8% |
| Taiwanese | 0.0 /100 | #289 | Tragic 94.8% |
| Malaysians | 0.0 /100 | #290 | Tragic 94.8% |
| Immigrants | Grenada | 0.0 /100 | #291 | Tragic 94.8% |
| Immigrants | West Indies | 0.0 /100 | #292 | Tragic 94.8% |
| Fijians | 0.0 /100 | #293 | Tragic 94.7% |
| Haitians | 0.0 /100 | #294 | Tragic 94.7% |
| Yaqui | 0.0 /100 | #295 | Tragic 94.6% |
| Cubans | 0.0 /100 | #296 | Tragic 94.6% |
| Immigrants | South Eastern Asia | 0.0 /100 | #297 | Tragic 94.5% |
| Indonesians | 0.0 /100 | #298 | Tragic 94.5% |
| Bangladeshis | 0.0 /100 | #299 | Tragic 94.5% |
| Immigrants | Burma/Myanmar | 0.0 /100 | #300 | Tragic 94.5% |
| Immigrants | Dominica | 0.0 /100 | #301 | Tragic 94.5% |
| Immigrants | Laos | 0.0 /100 | #302 | Tragic 94.5% |
| Sri Lankans | 0.0 /100 | #303 | Tragic 94.4% |
| Immigrants | Haiti | 0.0 /100 | #304 | Tragic 94.3% |
| Guyanese | 0.0 /100 | #305 | Tragic 94.3% |