Puget Sound Salish vs Black/African American 7th Grade
COMPARE
Puget Sound Salish
Black/African American
7th Grade
7th Grade Comparison
Puget Sound Salish
Blacks/African Americans
96.7%
7TH GRADE
99.0/ 100
METRIC RATING
88th/ 347
METRIC RANK
96.0%
7TH GRADE
49.5/ 100
METRIC RATING
175th/ 347
METRIC RANK
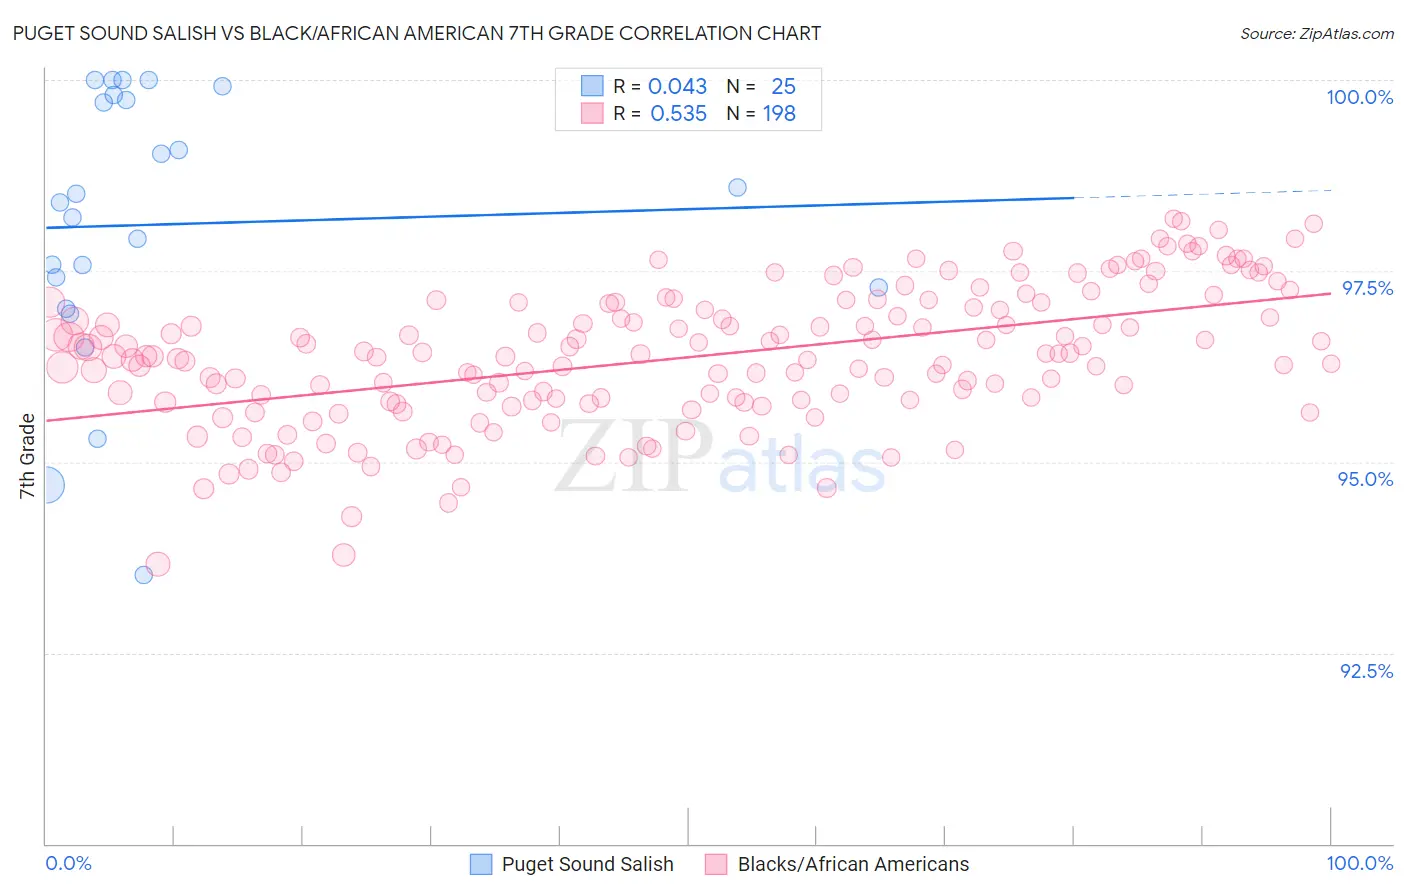
Puget Sound Salish vs Black/African American 7th Grade Correlation Chart
The statistical analysis conducted on geographies consisting of 46,155,775 people shows no correlation between the proportion of Puget Sound Salish and percentage of population with at least 7th grade education in the United States with a correlation coefficient (R) of 0.043 and weighted average of 96.7%. Similarly, the statistical analysis conducted on geographies consisting of 561,177,341 people shows a substantial positive correlation between the proportion of Blacks/African Americans and percentage of population with at least 7th grade education in the United States with a correlation coefficient (R) of 0.535 and weighted average of 96.0%, a difference of 0.71%.
7th Grade Correlation Summary
| Measurement | Puget Sound Salish | Black/African American |
| Minimum | 93.5% | 93.7% |
| Maximum | 100.0% | 98.2% |
| Range | 6.5% | 4.5% |
| Mean | 98.1% | 96.4% |
| Median | 98.4% | 96.4% |
| Interquartile 25% (IQ1) | 97.1% | 95.8% |
| Interquartile 75% (IQ3) | 99.8% | 97.1% |
| Interquartile Range (IQR) | 2.6% | 1.3% |
| Standard Deviation (Sample) | 1.8% | 0.90% |
| Standard Deviation (Population) | 1.7% | 0.89% |
Similar Demographics by 7th Grade
Demographics Similar to Puget Sound Salish by 7th Grade
In terms of 7th grade, the demographic groups most similar to Puget Sound Salish are Immigrants from Belgium (96.7%, a difference of 0.0%), Cree (96.7%, a difference of 0.0%), Turkish (96.7%, a difference of 0.010%), Immigrants from South Africa (96.7%, a difference of 0.010%), and Osage (96.7%, a difference of 0.010%).
| Demographics | Rating | Rank | 7th Grade |
| Delaware | 99.2 /100 | #81 | Exceptional 96.8% |
| Chickasaw | 99.2 /100 | #82 | Exceptional 96.7% |
| Icelanders | 99.1 /100 | #83 | Exceptional 96.7% |
| Romanians | 99.1 /100 | #84 | Exceptional 96.7% |
| Kiowa | 99.1 /100 | #85 | Exceptional 96.7% |
| Turks | 99.1 /100 | #86 | Exceptional 96.7% |
| Immigrants | Belgium | 99.0 /100 | #87 | Exceptional 96.7% |
| Puget Sound Salish | 99.0 /100 | #88 | Exceptional 96.7% |
| Cree | 99.0 /100 | #89 | Exceptional 96.7% |
| Immigrants | South Africa | 98.9 /100 | #90 | Exceptional 96.7% |
| Osage | 98.9 /100 | #91 | Exceptional 96.7% |
| Immigrants | Western Europe | 98.9 /100 | #92 | Exceptional 96.7% |
| Potawatomi | 98.9 /100 | #93 | Exceptional 96.7% |
| Lebanese | 98.8 /100 | #94 | Exceptional 96.7% |
| Immigrants | Australia | 98.8 /100 | #95 | Exceptional 96.7% |
Demographics Similar to Blacks/African Americans by 7th Grade
In terms of 7th grade, the demographic groups most similar to Blacks/African Americans are Mongolian (96.0%, a difference of 0.0%), Chilean (96.0%, a difference of 0.0%), Immigrants from Korea (96.0%, a difference of 0.0%), Venezuelan (96.0%, a difference of 0.010%), and Immigrants from Albania (96.0%, a difference of 0.010%).
| Demographics | Rating | Rank | 7th Grade |
| Immigrants | Poland | 59.0 /100 | #168 | Average 96.1% |
| Ute | 55.8 /100 | #169 | Average 96.1% |
| Immigrants | Ukraine | 55.0 /100 | #170 | Average 96.1% |
| Egyptians | 54.2 /100 | #171 | Average 96.1% |
| Venezuelans | 51.4 /100 | #172 | Average 96.0% |
| Immigrants | Albania | 50.4 /100 | #173 | Average 96.0% |
| Mongolians | 50.0 /100 | #174 | Average 96.0% |
| Blacks/African Americans | 49.5 /100 | #175 | Average 96.0% |
| Chileans | 49.3 /100 | #176 | Average 96.0% |
| Immigrants | Korea | 49.2 /100 | #177 | Average 96.0% |
| Marshallese | 48.4 /100 | #178 | Average 96.0% |
| Immigrants | Iran | 47.8 /100 | #179 | Average 96.0% |
| Immigrants | Brazil | 46.8 /100 | #180 | Average 96.0% |
| Pakistanis | 44.5 /100 | #181 | Average 96.0% |
| Iraqis | 41.2 /100 | #182 | Average 96.0% |