Paiute vs Immigrants from Burma/Myanmar 7th Grade
COMPARE
Paiute
Immigrants from Burma/Myanmar
7th Grade
7th Grade Comparison
Paiute
Immigrants from Burma/Myanmar
95.4%
7TH GRADE
1.2/ 100
METRIC RATING
248th/ 347
METRIC RANK
94.5%
7TH GRADE
0.0/ 100
METRIC RATING
300th/ 347
METRIC RANK
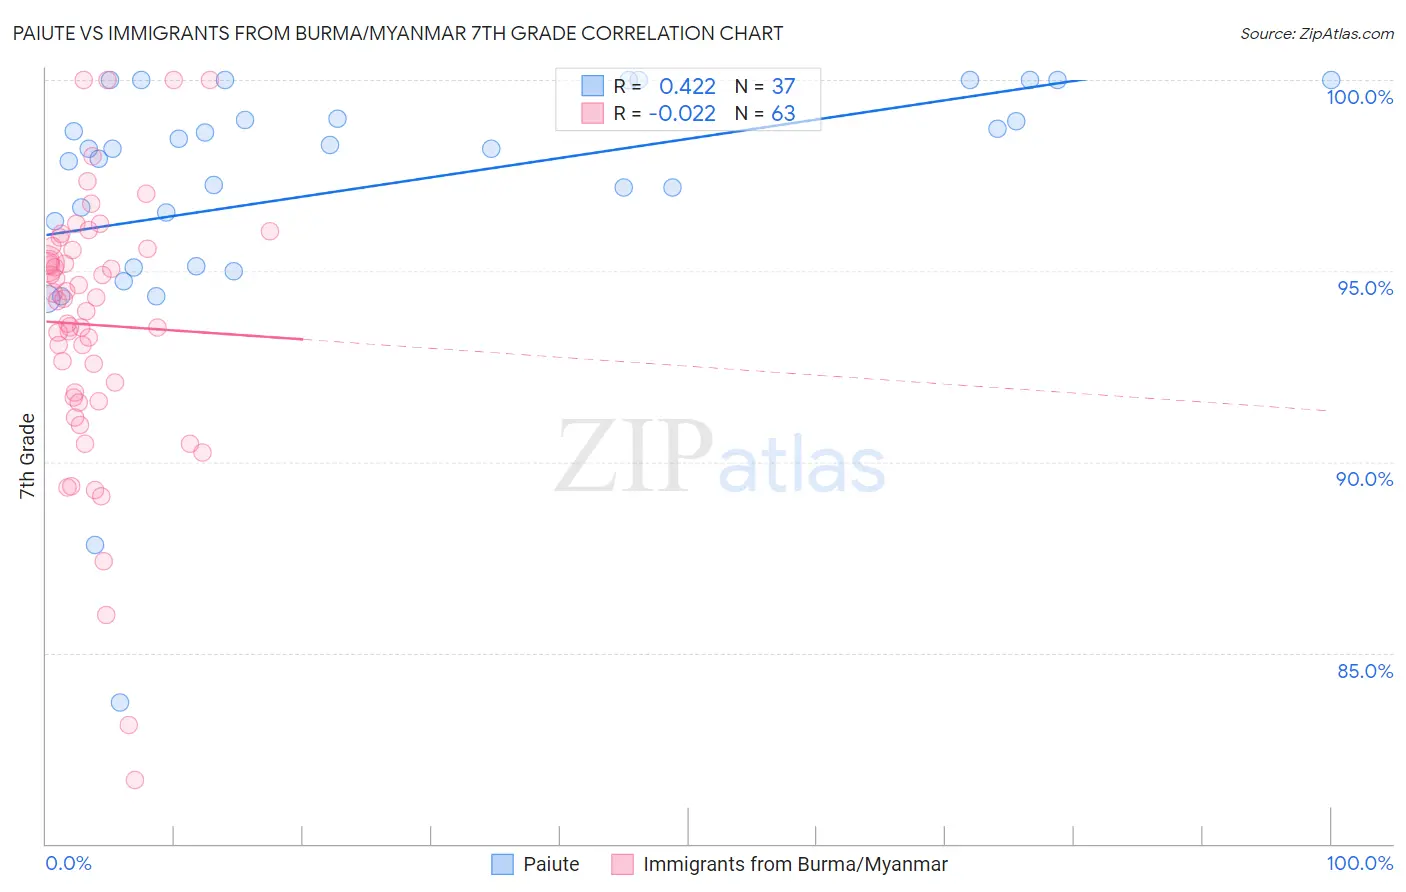
Paiute vs Immigrants from Burma/Myanmar 7th Grade Correlation Chart
The statistical analysis conducted on geographies consisting of 58,403,520 people shows a moderate positive correlation between the proportion of Paiute and percentage of population with at least 7th grade education in the United States with a correlation coefficient (R) of 0.422 and weighted average of 95.4%. Similarly, the statistical analysis conducted on geographies consisting of 172,345,696 people shows no correlation between the proportion of Immigrants from Burma/Myanmar and percentage of population with at least 7th grade education in the United States with a correlation coefficient (R) of -0.022 and weighted average of 94.5%, a difference of 0.95%.
7th Grade Correlation Summary
| Measurement | Paiute | Immigrants from Burma/Myanmar |
| Minimum | 83.7% | 81.7% |
| Maximum | 100.0% | 100.0% |
| Range | 16.3% | 18.3% |
| Mean | 97.2% | 93.6% |
| Median | 98.2% | 94.3% |
| Interquartile 25% (IQ1) | 95.7% | 91.7% |
| Interquartile 75% (IQ3) | 99.5% | 95.6% |
| Interquartile Range (IQR) | 3.8% | 3.9% |
| Standard Deviation (Sample) | 3.4% | 3.6% |
| Standard Deviation (Population) | 3.3% | 3.5% |
Similar Demographics by 7th Grade
Demographics Similar to Paiute by 7th Grade
In terms of 7th grade, the demographic groups most similar to Paiute are Bolivian (95.4%, a difference of 0.010%), Tongan (95.4%, a difference of 0.020%), Immigrants from Cameroon (95.4%, a difference of 0.030%), Immigrants from Jamaica (95.4%, a difference of 0.030%), and Immigrants from Ethiopia (95.3%, a difference of 0.030%).
| Demographics | Rating | Rank | 7th Grade |
| South American Indians | 2.0 /100 | #241 | Tragic 95.5% |
| Immigrants | Senegal | 1.9 /100 | #242 | Tragic 95.5% |
| U.S. Virgin Islanders | 1.6 /100 | #243 | Tragic 95.4% |
| Uruguayans | 1.6 /100 | #244 | Tragic 95.4% |
| Immigrants | Middle Africa | 1.5 /100 | #245 | Tragic 95.4% |
| Ethiopians | 1.5 /100 | #246 | Tragic 95.4% |
| Tongans | 1.3 /100 | #247 | Tragic 95.4% |
| Paiute | 1.2 /100 | #248 | Tragic 95.4% |
| Bolivians | 1.1 /100 | #249 | Tragic 95.4% |
| Immigrants | Cameroon | 0.9 /100 | #250 | Tragic 95.4% |
| Immigrants | Jamaica | 0.9 /100 | #251 | Tragic 95.4% |
| Immigrants | Ethiopia | 0.9 /100 | #252 | Tragic 95.3% |
| Somalis | 0.9 /100 | #253 | Tragic 95.3% |
| Colombians | 0.8 /100 | #254 | Tragic 95.3% |
| Koreans | 0.8 /100 | #255 | Tragic 95.3% |
Demographics Similar to Immigrants from Burma/Myanmar by 7th Grade
In terms of 7th grade, the demographic groups most similar to Immigrants from Burma/Myanmar are Immigrants from Dominica (94.5%, a difference of 0.030%), Immigrants from Laos (94.5%, a difference of 0.030%), Immigrants from South Eastern Asia (94.5%, a difference of 0.040%), Indonesian (94.5%, a difference of 0.040%), and Bangladeshi (94.5%, a difference of 0.040%).
| Demographics | Rating | Rank | 7th Grade |
| Fijians | 0.0 /100 | #293 | Tragic 94.7% |
| Haitians | 0.0 /100 | #294 | Tragic 94.7% |
| Yaqui | 0.0 /100 | #295 | Tragic 94.6% |
| Cubans | 0.0 /100 | #296 | Tragic 94.6% |
| Immigrants | South Eastern Asia | 0.0 /100 | #297 | Tragic 94.5% |
| Indonesians | 0.0 /100 | #298 | Tragic 94.5% |
| Bangladeshis | 0.0 /100 | #299 | Tragic 94.5% |
| Immigrants | Burma/Myanmar | 0.0 /100 | #300 | Tragic 94.5% |
| Immigrants | Dominica | 0.0 /100 | #301 | Tragic 94.5% |
| Immigrants | Laos | 0.0 /100 | #302 | Tragic 94.5% |
| Sri Lankans | 0.0 /100 | #303 | Tragic 94.4% |
| Immigrants | Haiti | 0.0 /100 | #304 | Tragic 94.3% |
| Guyanese | 0.0 /100 | #305 | Tragic 94.3% |
| Immigrants | Guyana | 0.0 /100 | #306 | Tragic 94.2% |
| Immigrants | Portugal | 0.0 /100 | #307 | Tragic 94.2% |