Kenyan vs Guyanese College, Under 1 year
COMPARE
Kenyan
Guyanese
College, Under 1 year
College, Under 1 year Comparison
Kenyans
Guyanese
66.5%
COLLEGE, UNDER 1 YEAR
81.7/ 100
METRIC RATING
146th/ 347
METRIC RANK
59.0%
COLLEGE, UNDER 1 YEAR
0.0/ 100
METRIC RATING
297th/ 347
METRIC RANK
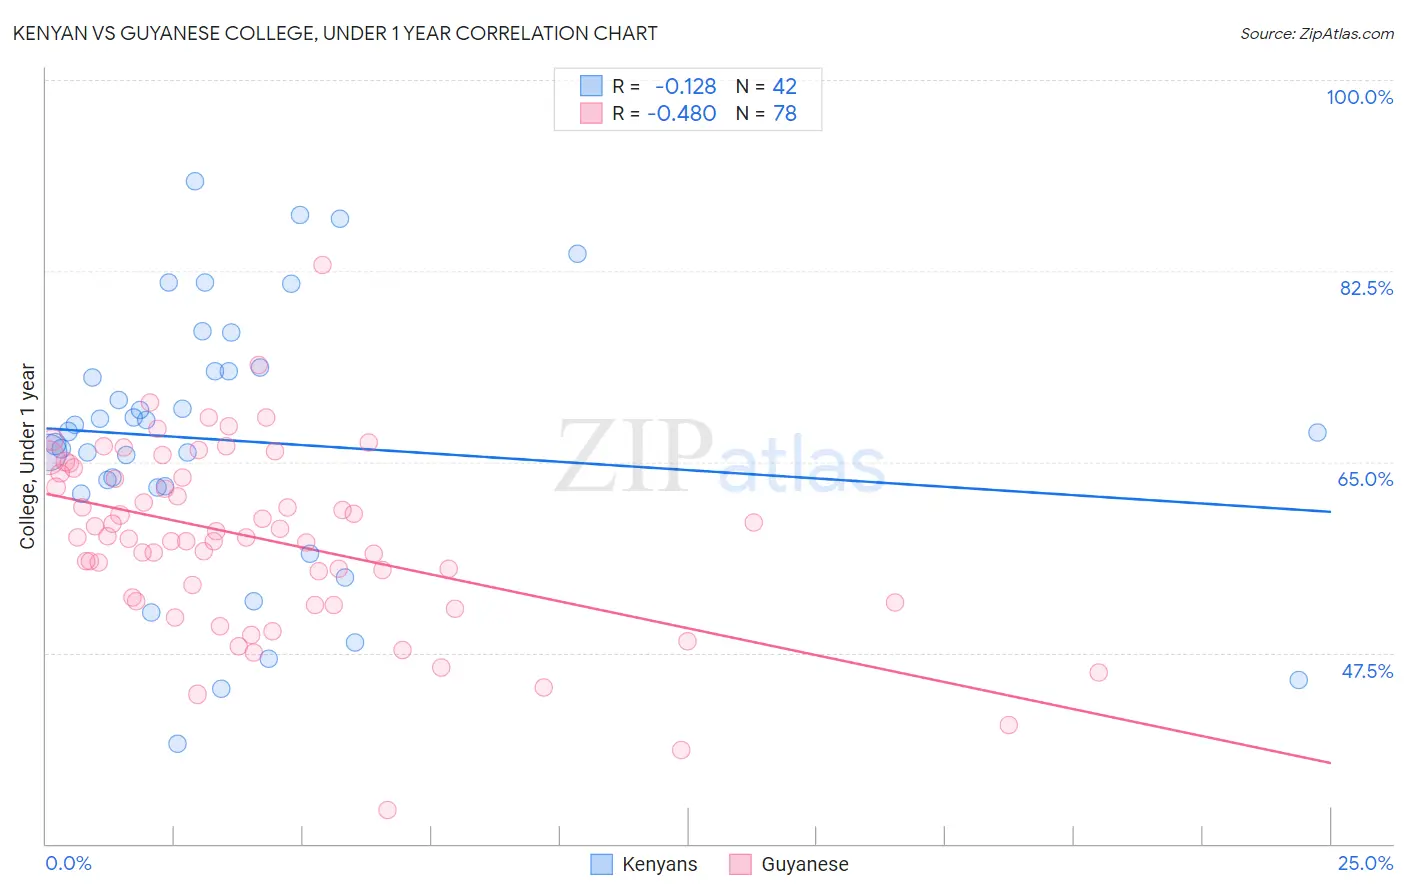
Kenyan vs Guyanese College, Under 1 year Correlation Chart
The statistical analysis conducted on geographies consisting of 168,244,481 people shows a poor negative correlation between the proportion of Kenyans and percentage of population with at least college, under 1 year education in the United States with a correlation coefficient (R) of -0.128 and weighted average of 66.5%. Similarly, the statistical analysis conducted on geographies consisting of 176,940,589 people shows a moderate negative correlation between the proportion of Guyanese and percentage of population with at least college, under 1 year education in the United States with a correlation coefficient (R) of -0.480 and weighted average of 59.0%, a difference of 12.7%.
College, Under 1 year Correlation Summary
| Measurement | Kenyan | Guyanese |
| Minimum | 39.1% | 33.1% |
| Maximum | 90.7% | 83.1% |
| Range | 51.6% | 50.0% |
| Mean | 66.9% | 57.9% |
| Median | 67.8% | 58.1% |
| Interquartile 25% (IQ1) | 62.7% | 52.3% |
| Interquartile 75% (IQ3) | 73.3% | 64.0% |
| Interquartile Range (IQR) | 10.6% | 11.7% |
| Standard Deviation (Sample) | 12.2% | 8.4% |
| Standard Deviation (Population) | 12.0% | 8.3% |
Similar Demographics by College, Under 1 year
Demographics Similar to Kenyans by College, Under 1 year
In terms of college, under 1 year, the demographic groups most similar to Kenyans are Immigrants from Kenya (66.5%, a difference of 0.0%), Immigrants from Morocco (66.5%, a difference of 0.0%), Immigrants from Germany (66.5%, a difference of 0.020%), Immigrants from Uganda (66.5%, a difference of 0.080%), and English (66.6%, a difference of 0.090%).
| Demographics | Rating | Rank | College, Under 1 year |
| Venezuelans | 85.9 /100 | #139 | Excellent 66.7% |
| Slavs | 85.9 /100 | #140 | Excellent 66.7% |
| Immigrants | Afghanistan | 85.1 /100 | #141 | Excellent 66.7% |
| English | 82.9 /100 | #142 | Excellent 66.6% |
| Immigrants | Uganda | 82.8 /100 | #143 | Excellent 66.5% |
| Immigrants | Germany | 82.0 /100 | #144 | Excellent 66.5% |
| Immigrants | Kenya | 81.8 /100 | #145 | Excellent 66.5% |
| Kenyans | 81.7 /100 | #146 | Excellent 66.5% |
| Immigrants | Morocco | 81.7 /100 | #147 | Excellent 66.5% |
| Taiwanese | 78.6 /100 | #148 | Good 66.4% |
| Immigrants | Venezuela | 77.9 /100 | #149 | Good 66.3% |
| Immigrants | Iraq | 77.1 /100 | #150 | Good 66.3% |
| Immigrants | Sudan | 76.0 /100 | #151 | Good 66.2% |
| Sudanese | 74.1 /100 | #152 | Good 66.2% |
| Belgians | 73.7 /100 | #153 | Good 66.2% |
Demographics Similar to Guyanese by College, Under 1 year
In terms of college, under 1 year, the demographic groups most similar to Guyanese are Central American Indian (59.0%, a difference of 0.040%), Immigrants from Grenada (59.1%, a difference of 0.080%), Immigrants from Belize (59.1%, a difference of 0.19%), Seminole (59.1%, a difference of 0.21%), and Nicaraguan (59.2%, a difference of 0.39%).
| Demographics | Rating | Rank | College, Under 1 year |
| Ecuadorians | 0.0 /100 | #290 | Tragic 59.3% |
| Creek | 0.0 /100 | #291 | Tragic 59.3% |
| Nicaraguans | 0.0 /100 | #292 | Tragic 59.2% |
| Seminole | 0.0 /100 | #293 | Tragic 59.1% |
| Immigrants | Belize | 0.0 /100 | #294 | Tragic 59.1% |
| Immigrants | Grenada | 0.0 /100 | #295 | Tragic 59.1% |
| Central American Indians | 0.0 /100 | #296 | Tragic 59.0% |
| Guyanese | 0.0 /100 | #297 | Tragic 59.0% |
| Immigrants | Ecuador | 0.0 /100 | #298 | Tragic 58.7% |
| Cubans | 0.0 /100 | #299 | Tragic 58.6% |
| Immigrants | Guyana | 0.0 /100 | #300 | Tragic 58.5% |
| Mexican American Indians | 0.0 /100 | #301 | Tragic 58.1% |
| Apache | 0.0 /100 | #302 | Tragic 58.0% |
| Immigrants | Dominica | 0.0 /100 | #303 | Tragic 57.9% |
| Kiowa | 0.0 /100 | #304 | Tragic 57.8% |