Puget Sound Salish vs Dutch West Indian Master's Degree
COMPARE
Puget Sound Salish
Dutch West Indian
Master's Degree
Master's Degree Comparison
Puget Sound Salish
Dutch West Indians
11.1%
MASTER'S DEGREE
0.0/ 100
METRIC RATING
309th/ 347
METRIC RANK
10.6%
MASTER'S DEGREE
0.0/ 100
METRIC RATING
324th/ 347
METRIC RANK
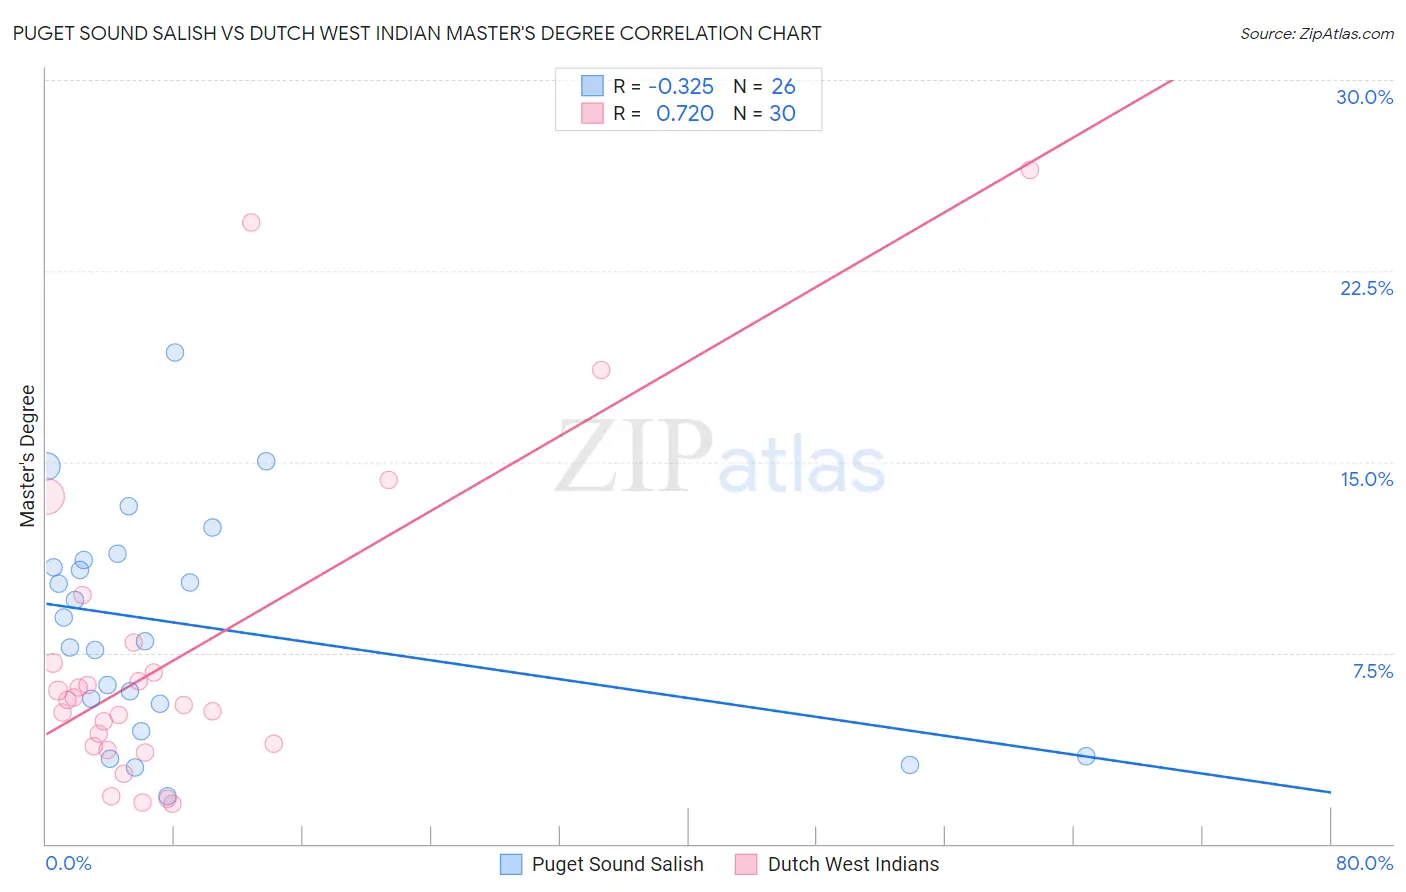
Puget Sound Salish vs Dutch West Indian Master's Degree Correlation Chart
The statistical analysis conducted on geographies consisting of 46,155,292 people shows a mild negative correlation between the proportion of Puget Sound Salish and percentage of population with at least master's degree education in the United States with a correlation coefficient (R) of -0.325 and weighted average of 11.1%. Similarly, the statistical analysis conducted on geographies consisting of 85,760,776 people shows a strong positive correlation between the proportion of Dutch West Indians and percentage of population with at least master's degree education in the United States with a correlation coefficient (R) of 0.720 and weighted average of 10.6%, a difference of 4.8%.
Master's Degree Correlation Summary
| Measurement | Puget Sound Salish | Dutch West Indian |
| Minimum | 1.9% | 1.6% |
| Maximum | 19.3% | 26.5% |
| Range | 17.5% | 24.9% |
| Mean | 8.6% | 7.3% |
| Median | 8.4% | 5.5% |
| Interquartile 25% (IQ1) | 5.5% | 3.8% |
| Interquartile 75% (IQ3) | 11.1% | 7.1% |
| Interquartile Range (IQR) | 5.6% | 3.3% |
| Standard Deviation (Sample) | 4.4% | 6.2% |
| Standard Deviation (Population) | 4.3% | 6.1% |
Demographics Similar to Puget Sound Salish and Dutch West Indians by Master's Degree
In terms of master's degree, the demographic groups most similar to Puget Sound Salish are Puerto Rican (11.2%, a difference of 0.29%), Shoshone (11.1%, a difference of 0.36%), Cheyenne (11.2%, a difference of 0.84%), Seminole (11.0%, a difference of 0.87%), and Choctaw (11.0%, a difference of 0.97%). Similarly, the demographic groups most similar to Dutch West Indians are Crow (10.6%, a difference of 0.040%), Sioux (10.7%, a difference of 0.44%), Pennsylvania German (10.7%, a difference of 1.1%), Inupiat (10.5%, a difference of 1.1%), and Creek (10.5%, a difference of 1.1%).
| Demographics | Rating | Rank | Master's Degree |
| Mexican American Indians | 0.0 /100 | #306 | Tragic 11.2% |
| Cheyenne | 0.0 /100 | #307 | Tragic 11.2% |
| Puerto Ricans | 0.0 /100 | #308 | Tragic 11.2% |
| Puget Sound Salish | 0.0 /100 | #309 | Tragic 11.1% |
| Shoshone | 0.0 /100 | #310 | Tragic 11.1% |
| Seminole | 0.0 /100 | #311 | Tragic 11.0% |
| Choctaw | 0.0 /100 | #312 | Tragic 11.0% |
| Yaqui | 0.0 /100 | #313 | Tragic 11.0% |
| Cajuns | 0.0 /100 | #314 | Tragic 11.0% |
| Apache | 0.0 /100 | #315 | Tragic 11.0% |
| Hispanics or Latinos | 0.0 /100 | #316 | Tragic 10.9% |
| Hopi | 0.0 /100 | #317 | Tragic 10.9% |
| Immigrants | Cuba | 0.0 /100 | #318 | Tragic 10.9% |
| Kiowa | 0.0 /100 | #319 | Tragic 10.8% |
| Immigrants | Micronesia | 0.0 /100 | #320 | Tragic 10.8% |
| Pennsylvania Germans | 0.0 /100 | #321 | Tragic 10.7% |
| Sioux | 0.0 /100 | #322 | Tragic 10.7% |
| Crow | 0.0 /100 | #323 | Tragic 10.6% |
| Dutch West Indians | 0.0 /100 | #324 | Tragic 10.6% |
| Inupiat | 0.0 /100 | #325 | Tragic 10.5% |
| Creek | 0.0 /100 | #326 | Tragic 10.5% |