Puerto Rican vs Immigrants from Philippines Bachelor's Degree
COMPARE
Puerto Rican
Immigrants from Philippines
Bachelor's Degree
Bachelor's Degree Comparison
Puerto Ricans
Immigrants from Philippines
31.0%
BACHELOR'S DEGREE
0.1/ 100
METRIC RATING
289th/ 347
METRIC RANK
36.4%
BACHELOR'S DEGREE
17.8/ 100
METRIC RATING
212th/ 347
METRIC RANK
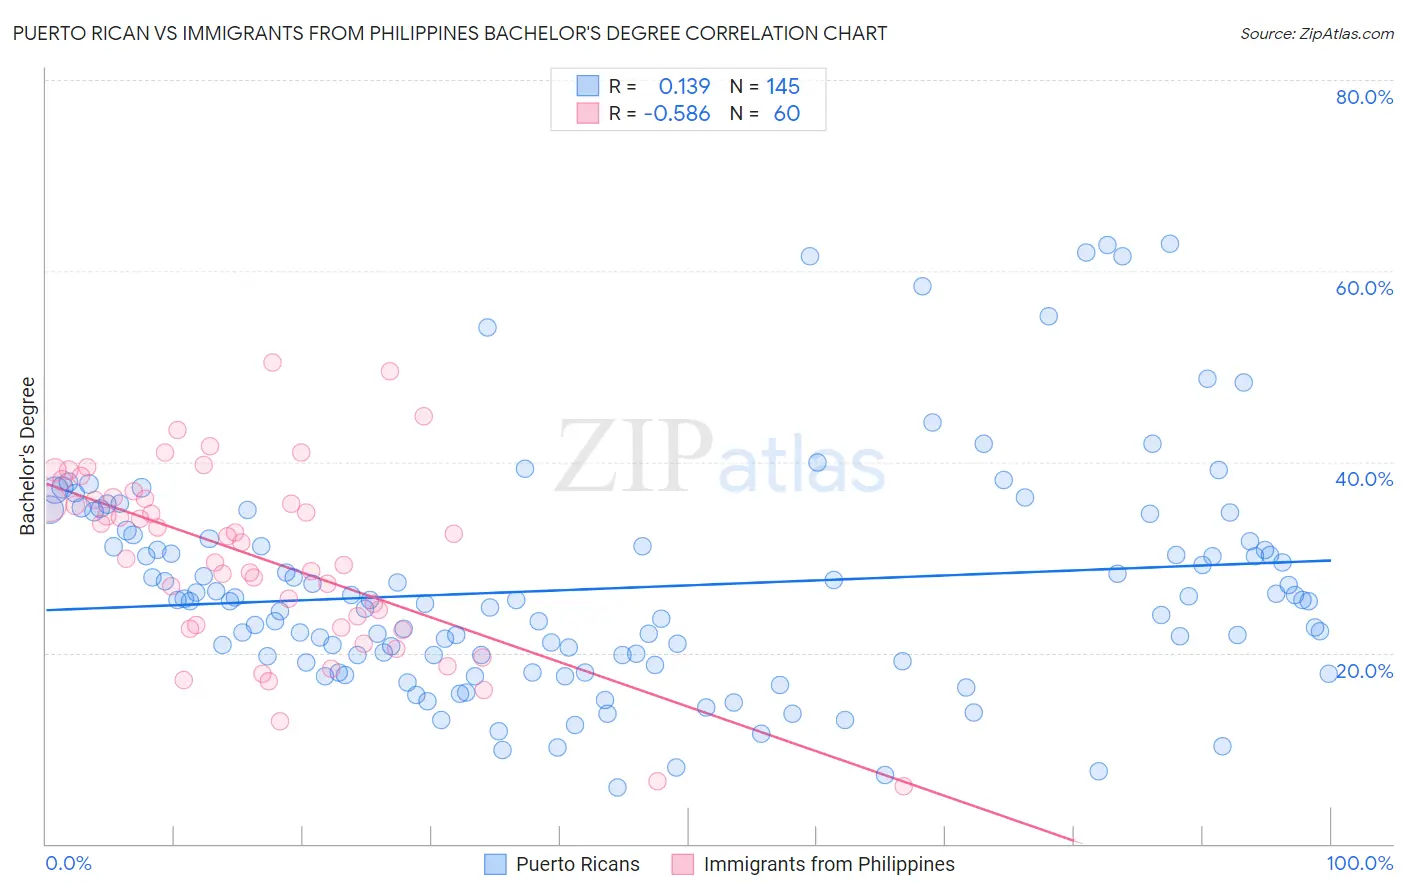
Puerto Rican vs Immigrants from Philippines Bachelor's Degree Correlation Chart
The statistical analysis conducted on geographies consisting of 528,221,445 people shows a poor positive correlation between the proportion of Puerto Ricans and percentage of population with at least bachelor's degree education in the United States with a correlation coefficient (R) of 0.139 and weighted average of 31.0%. Similarly, the statistical analysis conducted on geographies consisting of 471,284,617 people shows a substantial negative correlation between the proportion of Immigrants from Philippines and percentage of population with at least bachelor's degree education in the United States with a correlation coefficient (R) of -0.586 and weighted average of 36.4%, a difference of 17.7%.
Bachelor's Degree Correlation Summary
| Measurement | Puerto Rican | Immigrants from Philippines |
| Minimum | 5.9% | 6.0% |
| Maximum | 62.9% | 50.4% |
| Range | 57.0% | 44.4% |
| Mean | 26.8% | 30.0% |
| Median | 25.4% | 31.9% |
| Interquartile 25% (IQ1) | 19.4% | 22.8% |
| Interquartile 75% (IQ3) | 31.8% | 36.2% |
| Interquartile Range (IQR) | 12.4% | 13.4% |
| Standard Deviation (Sample) | 11.7% | 9.6% |
| Standard Deviation (Population) | 11.7% | 9.5% |
Similar Demographics by Bachelor's Degree
Demographics Similar to Puerto Ricans by Bachelor's Degree
In terms of bachelor's degree, the demographic groups most similar to Puerto Ricans are Immigrants from Honduras (30.9%, a difference of 0.040%), Black/African American (30.9%, a difference of 0.080%), Guatemalan (31.0%, a difference of 0.14%), Ute (30.9%, a difference of 0.16%), and Cape Verdean (30.9%, a difference of 0.26%).
| Demographics | Rating | Rank | Bachelor's Degree |
| Immigrants | Caribbean | 0.1 /100 | #282 | Tragic 31.4% |
| Hondurans | 0.1 /100 | #283 | Tragic 31.3% |
| Haitians | 0.1 /100 | #284 | Tragic 31.3% |
| Aleuts | 0.1 /100 | #285 | Tragic 31.3% |
| Immigrants | El Salvador | 0.1 /100 | #286 | Tragic 31.3% |
| Ottawa | 0.1 /100 | #287 | Tragic 31.1% |
| Guatemalans | 0.1 /100 | #288 | Tragic 31.0% |
| Puerto Ricans | 0.1 /100 | #289 | Tragic 31.0% |
| Immigrants | Honduras | 0.1 /100 | #290 | Tragic 30.9% |
| Blacks/African Americans | 0.1 /100 | #291 | Tragic 30.9% |
| Ute | 0.1 /100 | #292 | Tragic 30.9% |
| Cape Verdeans | 0.1 /100 | #293 | Tragic 30.9% |
| Immigrants | Guatemala | 0.0 /100 | #294 | Tragic 30.8% |
| Immigrants | Dominican Republic | 0.0 /100 | #295 | Tragic 30.7% |
| Puget Sound Salish | 0.0 /100 | #296 | Tragic 30.7% |
Demographics Similar to Immigrants from Philippines by Bachelor's Degree
In terms of bachelor's degree, the demographic groups most similar to Immigrants from Philippines are Scotch-Irish (36.4%, a difference of 0.080%), French (36.5%, a difference of 0.13%), Panamanian (36.5%, a difference of 0.16%), Immigrants from Thailand (36.5%, a difference of 0.26%), and Immigrants from Middle Africa (36.6%, a difference of 0.45%).
| Demographics | Rating | Rank | Bachelor's Degree |
| Finns | 22.2 /100 | #205 | Fair 36.7% |
| Spaniards | 21.2 /100 | #206 | Fair 36.6% |
| Immigrants | Middle Africa | 20.6 /100 | #207 | Fair 36.6% |
| Immigrants | Thailand | 19.4 /100 | #208 | Poor 36.5% |
| Panamanians | 18.8 /100 | #209 | Poor 36.5% |
| French | 18.6 /100 | #210 | Poor 36.5% |
| Scotch-Irish | 18.3 /100 | #211 | Poor 36.4% |
| Immigrants | Philippines | 17.8 /100 | #212 | Poor 36.4% |
| Immigrants | Panama | 14.2 /100 | #213 | Poor 36.2% |
| Germans | 13.9 /100 | #214 | Poor 36.1% |
| Immigrants | Western Africa | 13.8 /100 | #215 | Poor 36.1% |
| Barbadians | 13.5 /100 | #216 | Poor 36.1% |
| German Russians | 10.2 /100 | #217 | Poor 35.8% |
| Sub-Saharan Africans | 9.8 /100 | #218 | Tragic 35.8% |
| West Indians | 9.7 /100 | #219 | Tragic 35.8% |