Puerto Rican vs Panamanian 11th Grade
COMPARE
Puerto Rican
Panamanian
11th Grade
11th Grade Comparison
Puerto Ricans
Panamanians
88.4%
11TH GRADE
0.0/ 100
METRIC RATING
322nd/ 347
METRIC RANK
92.3%
11TH GRADE
26.4/ 100
METRIC RATING
196th/ 347
METRIC RANK
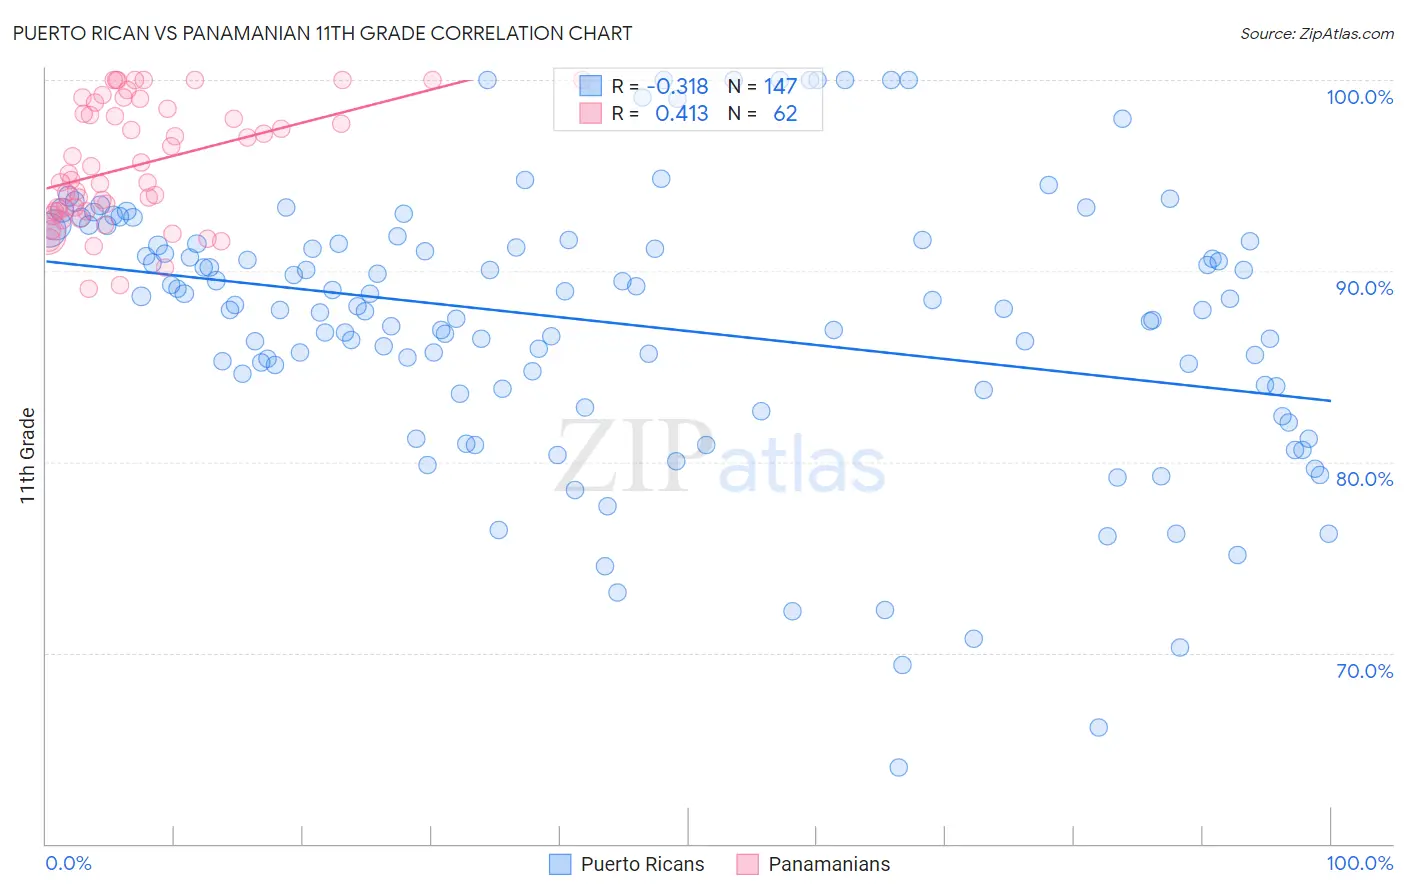
Puerto Rican vs Panamanian 11th Grade Correlation Chart
The statistical analysis conducted on geographies consisting of 528,320,613 people shows a mild negative correlation between the proportion of Puerto Ricans and percentage of population with at least 11th grade education in the United States with a correlation coefficient (R) of -0.318 and weighted average of 88.4%. Similarly, the statistical analysis conducted on geographies consisting of 281,248,945 people shows a moderate positive correlation between the proportion of Panamanians and percentage of population with at least 11th grade education in the United States with a correlation coefficient (R) of 0.413 and weighted average of 92.3%, a difference of 4.4%.
11th Grade Correlation Summary
| Measurement | Puerto Rican | Panamanian |
| Minimum | 64.0% | 89.1% |
| Maximum | 100.0% | 100.0% |
| Range | 36.0% | 10.9% |
| Mean | 87.3% | 95.6% |
| Median | 88.0% | 94.9% |
| Interquartile 25% (IQ1) | 83.8% | 93.1% |
| Interquartile 75% (IQ3) | 91.6% | 98.5% |
| Interquartile Range (IQR) | 7.7% | 5.4% |
| Standard Deviation (Sample) | 7.1% | 3.2% |
| Standard Deviation (Population) | 7.1% | 3.1% |
Similar Demographics by 11th Grade
Demographics Similar to Puerto Ricans by 11th Grade
In terms of 11th grade, the demographic groups most similar to Puerto Ricans are Pima (88.3%, a difference of 0.080%), Central American Indian (88.2%, a difference of 0.12%), Immigrants from Nicaragua (88.1%, a difference of 0.25%), Immigrants from Belize (88.7%, a difference of 0.39%), and Immigrants from Armenia (88.8%, a difference of 0.48%).
| Demographics | Rating | Rank | 11th Grade |
| Immigrants | Ecuador | 0.0 /100 | #315 | Tragic 89.1% |
| Immigrants | Cuba | 0.0 /100 | #316 | Tragic 88.9% |
| Lumbee | 0.0 /100 | #317 | Tragic 88.9% |
| Nicaraguans | 0.0 /100 | #318 | Tragic 88.9% |
| Belizeans | 0.0 /100 | #319 | Tragic 88.8% |
| Immigrants | Armenia | 0.0 /100 | #320 | Tragic 88.8% |
| Immigrants | Belize | 0.0 /100 | #321 | Tragic 88.7% |
| Puerto Ricans | 0.0 /100 | #322 | Tragic 88.4% |
| Pima | 0.0 /100 | #323 | Tragic 88.3% |
| Central American Indians | 0.0 /100 | #324 | Tragic 88.2% |
| Immigrants | Nicaragua | 0.0 /100 | #325 | Tragic 88.1% |
| Dominicans | 0.0 /100 | #326 | Tragic 87.7% |
| Immigrants | Cabo Verde | 0.0 /100 | #327 | Tragic 87.6% |
| Tohono O'odham | 0.0 /100 | #328 | Tragic 87.6% |
| Mexican American Indians | 0.0 /100 | #329 | Tragic 87.5% |
Demographics Similar to Panamanians by 11th Grade
In terms of 11th grade, the demographic groups most similar to Panamanians are Liberian (92.3%, a difference of 0.010%), Marshallese (92.3%, a difference of 0.010%), Hawaiian (92.3%, a difference of 0.010%), Immigrants from Uganda (92.3%, a difference of 0.020%), and Samoan (92.3%, a difference of 0.020%).
| Demographics | Rating | Rank | 11th Grade |
| Immigrants | Chile | 33.3 /100 | #189 | Fair 92.4% |
| Chickasaw | 31.4 /100 | #190 | Fair 92.3% |
| French American Indians | 30.8 /100 | #191 | Fair 92.3% |
| Immigrants | Syria | 30.4 /100 | #192 | Fair 92.3% |
| Moroccans | 28.7 /100 | #193 | Fair 92.3% |
| Sioux | 28.5 /100 | #194 | Fair 92.3% |
| Liberians | 26.8 /100 | #195 | Fair 92.3% |
| Panamanians | 26.4 /100 | #196 | Fair 92.3% |
| Marshallese | 26.0 /100 | #197 | Fair 92.3% |
| Hawaiians | 25.5 /100 | #198 | Fair 92.3% |
| Immigrants | Uganda | 25.2 /100 | #199 | Fair 92.3% |
| Samoans | 25.1 /100 | #200 | Fair 92.3% |
| Immigrants | China | 25.1 /100 | #201 | Fair 92.3% |
| Immigrants | Eastern Africa | 24.1 /100 | #202 | Fair 92.3% |
| Immigrants | Sudan | 23.5 /100 | #203 | Fair 92.3% |