Puerto Rican vs Immigrants from Panama 11th Grade
COMPARE
Puerto Rican
Immigrants from Panama
11th Grade
11th Grade Comparison
Puerto Ricans
Immigrants from Panama
88.4%
11TH GRADE
0.0/ 100
METRIC RATING
322nd/ 347
METRIC RANK
91.8%
11TH GRADE
4.3/ 100
METRIC RATING
228th/ 347
METRIC RANK
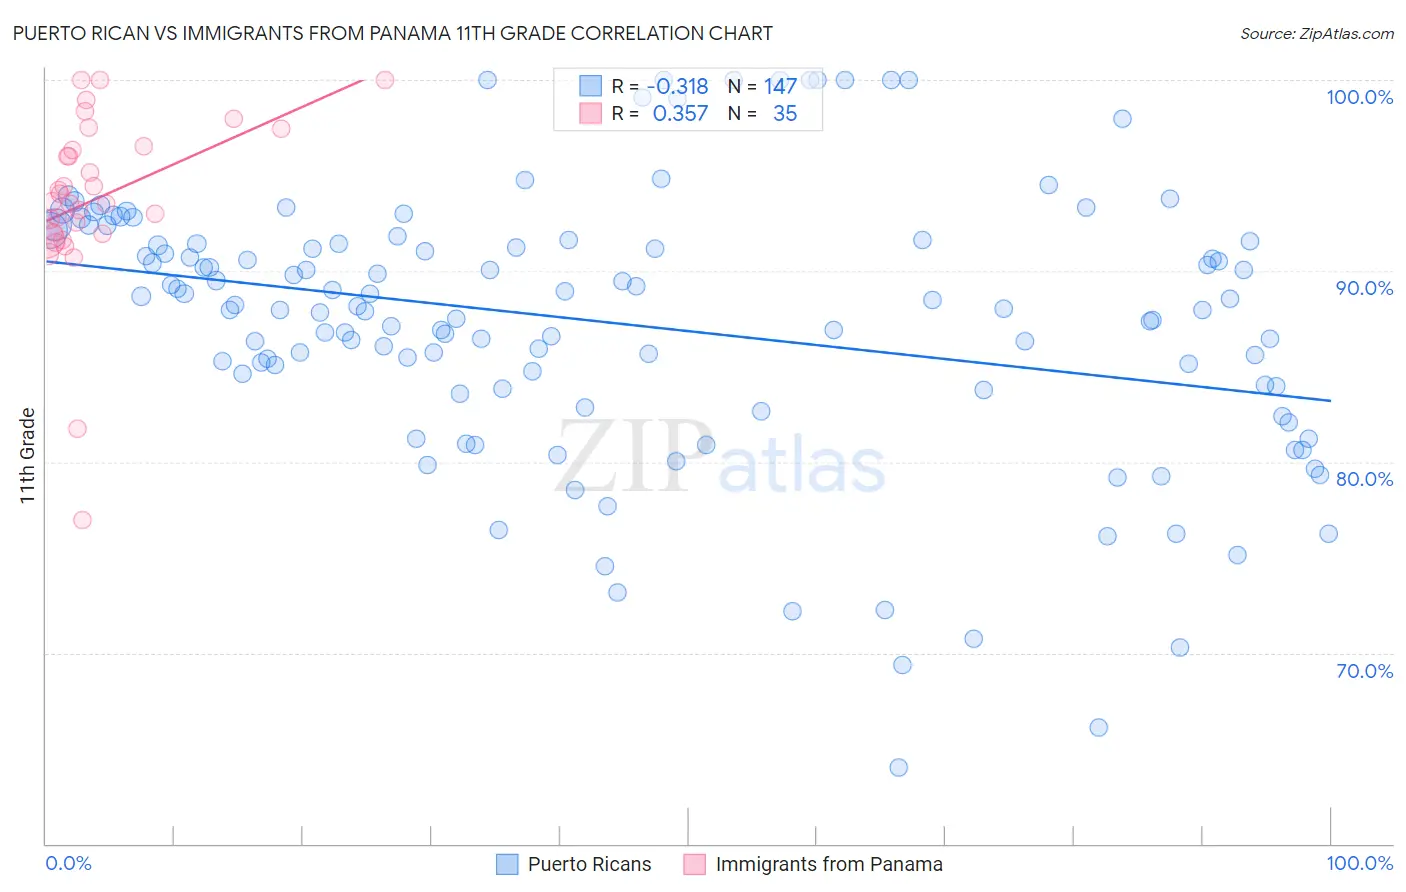
Puerto Rican vs Immigrants from Panama 11th Grade Correlation Chart
The statistical analysis conducted on geographies consisting of 528,320,613 people shows a mild negative correlation between the proportion of Puerto Ricans and percentage of population with at least 11th grade education in the United States with a correlation coefficient (R) of -0.318 and weighted average of 88.4%. Similarly, the statistical analysis conducted on geographies consisting of 221,183,192 people shows a mild positive correlation between the proportion of Immigrants from Panama and percentage of population with at least 11th grade education in the United States with a correlation coefficient (R) of 0.357 and weighted average of 91.8%, a difference of 3.9%.
11th Grade Correlation Summary
| Measurement | Puerto Rican | Immigrants from Panama |
| Minimum | 64.0% | 76.9% |
| Maximum | 100.0% | 100.0% |
| Range | 36.0% | 23.1% |
| Mean | 87.3% | 93.8% |
| Median | 88.0% | 93.6% |
| Interquartile 25% (IQ1) | 83.8% | 91.9% |
| Interquartile 75% (IQ3) | 91.6% | 96.5% |
| Interquartile Range (IQR) | 7.7% | 4.6% |
| Standard Deviation (Sample) | 7.1% | 4.6% |
| Standard Deviation (Population) | 7.1% | 4.5% |
Similar Demographics by 11th Grade
Demographics Similar to Puerto Ricans by 11th Grade
In terms of 11th grade, the demographic groups most similar to Puerto Ricans are Pima (88.3%, a difference of 0.080%), Central American Indian (88.2%, a difference of 0.12%), Immigrants from Nicaragua (88.1%, a difference of 0.25%), Immigrants from Belize (88.7%, a difference of 0.39%), and Immigrants from Armenia (88.8%, a difference of 0.48%).
| Demographics | Rating | Rank | 11th Grade |
| Immigrants | Ecuador | 0.0 /100 | #315 | Tragic 89.1% |
| Immigrants | Cuba | 0.0 /100 | #316 | Tragic 88.9% |
| Lumbee | 0.0 /100 | #317 | Tragic 88.9% |
| Nicaraguans | 0.0 /100 | #318 | Tragic 88.9% |
| Belizeans | 0.0 /100 | #319 | Tragic 88.8% |
| Immigrants | Armenia | 0.0 /100 | #320 | Tragic 88.8% |
| Immigrants | Belize | 0.0 /100 | #321 | Tragic 88.7% |
| Puerto Ricans | 0.0 /100 | #322 | Tragic 88.4% |
| Pima | 0.0 /100 | #323 | Tragic 88.3% |
| Central American Indians | 0.0 /100 | #324 | Tragic 88.2% |
| Immigrants | Nicaragua | 0.0 /100 | #325 | Tragic 88.1% |
| Dominicans | 0.0 /100 | #326 | Tragic 87.7% |
| Immigrants | Cabo Verde | 0.0 /100 | #327 | Tragic 87.6% |
| Tohono O'odham | 0.0 /100 | #328 | Tragic 87.6% |
| Mexican American Indians | 0.0 /100 | #329 | Tragic 87.5% |
Demographics Similar to Immigrants from Panama by 11th Grade
In terms of 11th grade, the demographic groups most similar to Immigrants from Panama are Immigrants from Cameroon (91.8%, a difference of 0.0%), Nigerian (91.8%, a difference of 0.0%), Immigrants from Afghanistan (91.8%, a difference of 0.030%), Choctaw (91.8%, a difference of 0.040%), and Immigrants from Somalia (91.9%, a difference of 0.050%).
| Demographics | Rating | Rank | 11th Grade |
| Immigrants | Liberia | 7.0 /100 | #221 | Tragic 91.9% |
| Immigrants | Africa | 6.5 /100 | #222 | Tragic 91.9% |
| Immigrants | Bahamas | 6.5 /100 | #223 | Tragic 91.9% |
| Costa Ricans | 6.3 /100 | #224 | Tragic 91.9% |
| Immigrants | Zaire | 5.4 /100 | #225 | Tragic 91.9% |
| Immigrants | Somalia | 5.2 /100 | #226 | Tragic 91.9% |
| Immigrants | Cameroon | 4.4 /100 | #227 | Tragic 91.8% |
| Immigrants | Panama | 4.3 /100 | #228 | Tragic 91.8% |
| Nigerians | 4.3 /100 | #229 | Tragic 91.8% |
| Immigrants | Afghanistan | 3.9 /100 | #230 | Tragic 91.8% |
| Choctaw | 3.7 /100 | #231 | Tragic 91.8% |
| Uruguayans | 3.5 /100 | #232 | Tragic 91.8% |
| Cheyenne | 3.3 /100 | #233 | Tragic 91.8% |
| Armenians | 2.9 /100 | #234 | Tragic 91.7% |
| Sub-Saharan Africans | 2.9 /100 | #235 | Tragic 91.7% |